I am recording a 30 second 1000Hz Sine wave, saving it to a list, splitting the list into 5 second sublists and I would like to apply a notch filter to each sublist to check when the signal drops out for a few samples (I'm filtering out the 1000Hz frequencies). I am using python along with scipy for signal processing. I had some success using this method when I recorded the signal and applied a filter to the entire signal at once, but whenever I try to apply a filter consecutively to 5 second chunks of the signal, I seem to detect glitches that aren't there. Here is the code for my filter.
   f0 = 1000.0  # Frequency to be removed from signal (Hz)
    Q = 30.0  # Quality factor
    w0 = f0/(fs/2.0)  # Normalized Frequency
    # Design notch filter
    b, a = signal.iirnotch(w0, Q)
    sos = signal.tf2sos(b,a)
    zi = signal.sosfilt_zi(sos)*lists[0][0]
    for list in lists: #each list is 5 seconds long
        Time=np.linspace(0, len(list)/fs, num=len(list))
        plot_graph(Time,list,fs)
        y_sos, zi = signal.sosfilt(sos, list, zi=zi*list[0])
        plot_graph(Time,y_sos,fs)
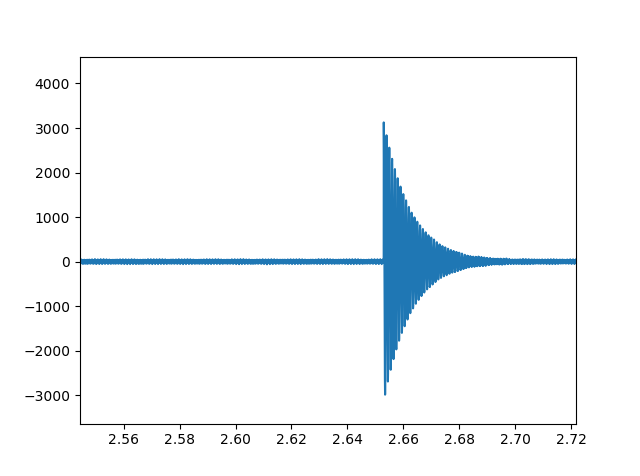
The graph below shows the first filtered 5 second chunk.
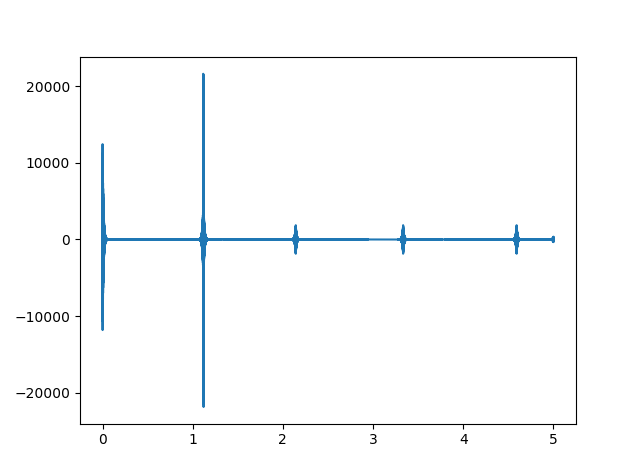
The large peak just after one second is a genuine dropout but the 3 smaller peaks should not occur at all.
The graph below shows the next filtered 5 second chunk
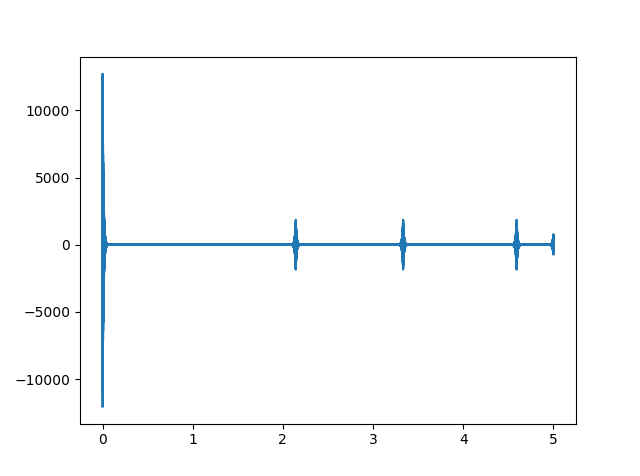
There are no glitches at all in this section, yet the small peaks still occur. I would also ideally like to get rid of the peak that begins at 0 and 5 seconds of each chunk. Can anyone tell me what is wrong with my filter/method?
Edit:
Changed my code to the following:
    f0 = 1000.0  # Frequency to be removed from signal (Hz)
    Q = 30.0  # Quality factor
    w0 = f0/(fs/2.0)  # Normalized Frequency
    # Design notch filter
    b, a = signal.iirnotch(w0, Q)
    zi = signal.lfilter_zi(b,a)*lists[0][0]
    for list in lists: #each list is 5 seconds long
        Time=np.linspace(0, len(list)/fs, num=len(list))
        plot_graph(Time,list,fs)
        y, zi = signal.lfilter(b, a, list, zi=zi)
        plot_graph(Time,y,fs)
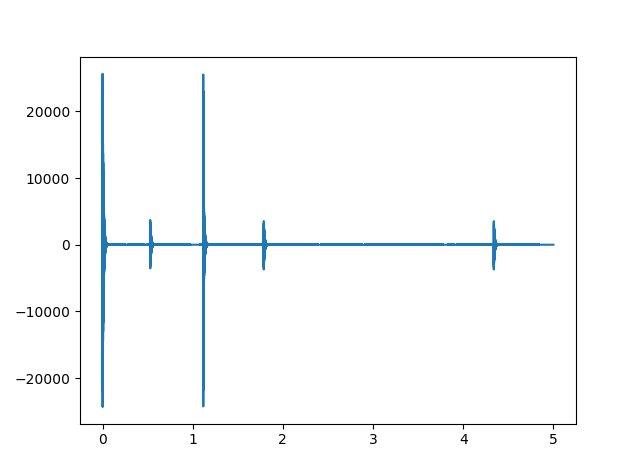
I'm still obtaining the same problem of strange peaks occuring where they shouldn't although it seems to remove the peak that occurs at the beginning and the end of each chunk. The following graph shows the first filtered 5 seconds, the big peak after 1 second being a genuine dropout, the smaller ones are not sropouts.
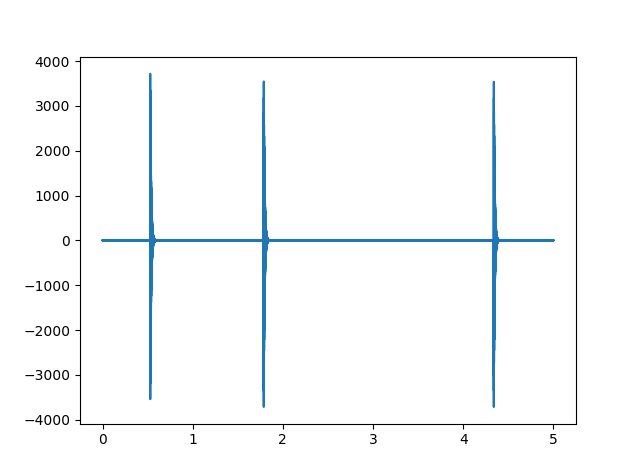
The following graph shows the next filtered 5 seconds where there are no dropouts and these peaks should not be occuring at all.

iirnotchis always 2nd-order, so there's no point in converting it to 2nd-order sectionssosform $\endgroup$