5
$\begingroup$

I have a guitar music signal and I want to detect the onset points via energy.

This is the signal example:
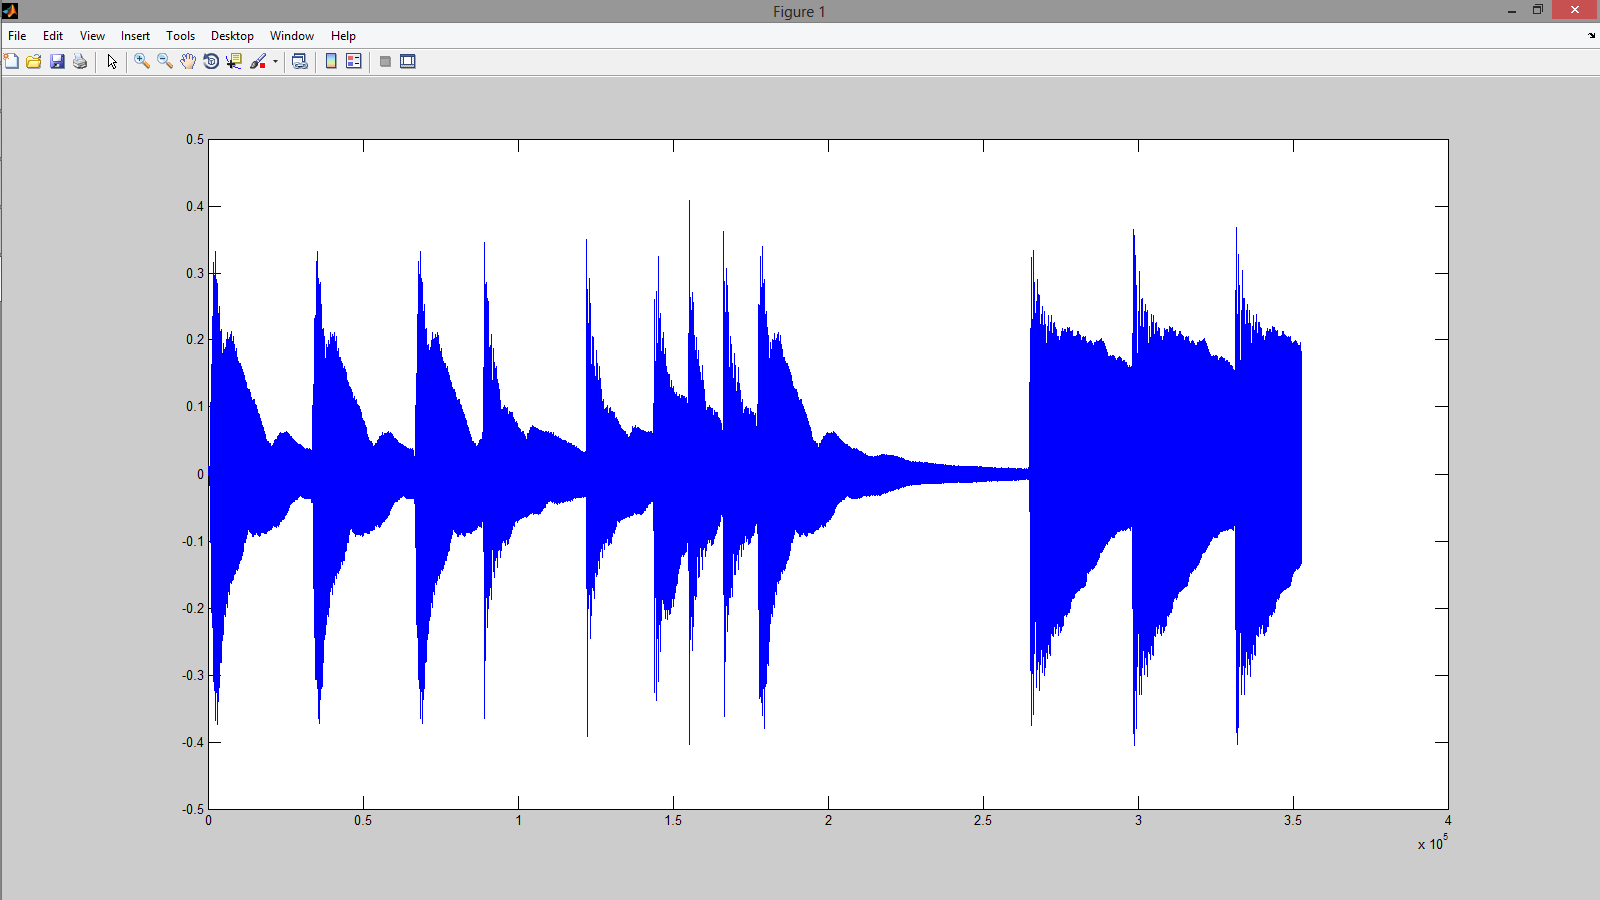
Signal

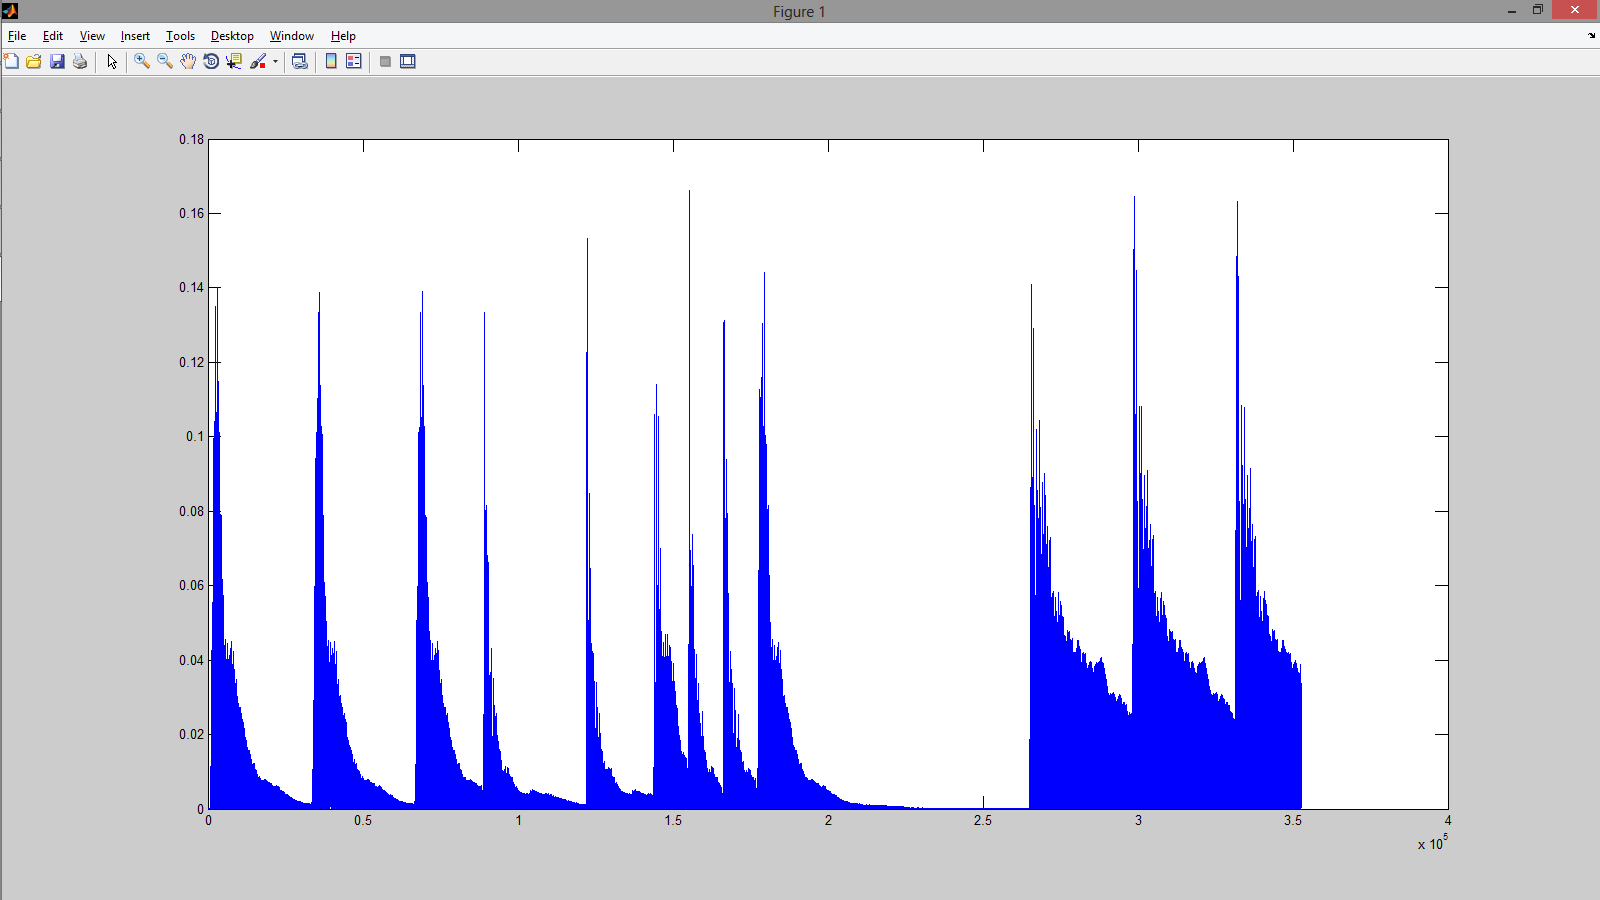
This is the energy plot:

Energy

My question is what would be the best method defining the threshold and consequently finding the peaks. I reckon I will have to set a window length and a window step (I am thinking 1000 and 100 samples respectively on a 44.1KHz sampling rate) and then every loop defining a new threshold (adaptive/local threshold). Every loop I would have to find the window average and compare it to the threshold. I have these questions:

1) Does window length = 1000 samples and window step = 100 seems reasonable?

2) How the threshold would be defined each loop and in relation to what?

3) If a window is above length which samples in it would I consider peaks? I think it would be somewhere in the middle but what range around it?

Maybe, window middle - window step < peak samples < window middle + window step ?

Thank you for your help.

$\endgroup$
2
  • $\begingroup$ Perhaps implement an F-Test or one of the other statistical analysis of variance tests. $\endgroup$
    – rickhg12hs
    Commented Nov 14, 2013 at 20:12
  • $\begingroup$ do you have a sample we can try? $\endgroup$ Commented Dec 17, 2013 at 3:46

1 Answer 1

3
$\begingroup$
  1. compute RMS from audio signal to get power
  2. do AGC (automatic gain control)
  3. perform "discrete differentiation" (the simplest is 1st order: $y[i] = x[i] - x[i-1]$)
  4. if the value is greater than certain threshold, it means we have an onset. You have to determinate the threshold experimentally or use adaptive algorithm. Obviously you also need some kind of lowpass filter to filter the noise.

You may want to swap steps 2 and 3.

If you can use software libraries, check out aubio.

Possible duplicate of https://stackoverflow.com/questions/294468/note-onset-detection

$\endgroup$
2
  • $\begingroup$ I've already read the linked article but there are many problems with the method described. The most important of all that the compression is described in terms of the specific track. It is very very hard to find a compression threshold that applies to every track. So I abandoned this idea a long time ago. I feel that the second diagram, which is variance, x1 = (x-m)^2, seems really good to extract information. My question was how would I find the onset points. The obvious answer, that works pretty ok, is to take the plot average and define the threshold in relation to the average. $\endgroup$ Commented Nov 18, 2013 at 11:32
  • $\begingroup$ compression and then fixed thresholding is the same as having no compression but the threshold adjusted in proportion to the energy or magnitude signal. some people might suggest computing the envelope from the analytic signal (which you get from use of the Hilbert Transform), but i think squaring is good enough. you might want to run a peak level detector with a decay rate on that squared energy signal. and then define your threshold to be some percent of the detected and smoothed peak level. $\endgroup$ Commented Mar 17, 2014 at 3:13

Your Answer

By clicking “Post Your Answer”, you agree to our terms of service and acknowledge you have read our privacy policy.

Not the answer you're looking for? Browse other questions tagged or ask your own question.