I need to preprocess raw ecg data in R, here is a sample already standardized. I'm not an expert in signal processing nor experienced in working with medical data,...
Not being an expert on how the heart works and how its phases manifest themselves on the ElectroCardioGram (ECG) is not a problem. But it would help immensely if you mentioned what is the purpose of this, i.e what do you want to do, what are your specifications and constraints?
For example "We put the driver in the car, they go through the track a few times and then we want to know what was their heartbeat at a specific point in the track".
Excellent, then, do not even use ElectroCardioGraphy (ECG) because:
The electrical environment of the racing car is incredibly noisy already. For comparison, you are trying to measure a signal that has a max amplitude of a few mV through long leads that have to run from the chest of the driver to the ECG box. Just a short distance away from this long electrical loop, you have sparks going on and off, relays turning big loads on and off, electrical motors or stepper motors turning. All of these things create fields that the loop will pick up and they will contaminate your signal.
ECG measures the electrical activity of the heart via contact electrodes. Which means that the skin of the driver would have to be prepared, ideally shaved, cleaned with alcohol, then have a conductive gel applied to it and finally apply the electrodes and fix them with medical tape. Throughout the track, I would not expect the driver to pay attention to the electrodes or, to not sweat. Even in controlled conditions, if you tap the electrodes with your hand, you can observe changes in the signal.
Instead, use Pulse Oximetry. This is the way that most gadgets (e.g. smart watches, fitness wrist bands, etc) obtain Beats per Minute from the heart today. Pulse oximetry needs to have contact with the skin, but not because it measures electricity. Very briefly: It measures the attenuation of light that is proportional to the blood flow below it. Because the heart is pumping blood in a rythmic way, the flow is rythmic as well and this signal can be used to derive a relatively accurate BPM count.
It will also be much easier to cross reference this with the rest of the telemetry because it will simply be a time series of BPM measurements. Pulse oxymeters for people to manage their heart conditions are more accurate than gadget type instruments. But then again, they might get a bit of getting used to by the driver. (For an example, see this)
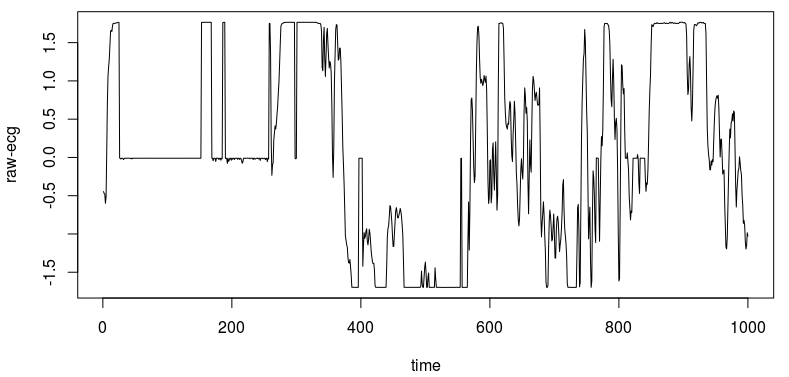
Below is a plot of how the data looks like,
No way.
Here (and here ) is what typical ECG signals look like.
To extract BPM, you need to "detect" those spikes which correspond to heart contractions and then measure the timing between them (also known as R-R interval, because the main spike of the ECG is the R peak).
Very briefly: QRS Detectors work by Pre-filtering -> Rectification -> Integration -> Thresholding -> QRS Complex pulse sequence -> R interval extraction -> Beat Detection. For much more detailed information about this, have a look at Moody's work.
What is depicted in the plot is saturation and possibly lots of noise from the contact. There is no trace of "typical" ECG complexes to work with.
Question 1) What strategy is needed in terms of subsampling, filtering to preprocess the data to clean get a clean ECG signal (google how it should look).
Why subsample? The signal is already in a bad state, why make it even worse? You could try a bandpass filter between 0.1 - 100Hz. This would reduce DC and cut out any high frequency noise but you have a lot of spikes which means that most of time times you will be "hearing" the ringing of the filter.
Question 2) Would this strategy work for EMG data also?
EMG is even worse because it picks up signals at higher frequencies. What is the application?
If you are trying to see the timing of the driver as to WHEN do they start to accelerate (i.e. leg muscles start working) versus when the car actually accelerates or brakes (i.e. break signal from telemetry), then maybe you can get away with very simple processing using thresholds. But if you are trying to make more fine measurements, you might be back into the same problem of lots of noise from various sources. In the case of EMG you will have to work around those, which means, twisted pair wires, shielding, as short lengths as possible, very good contact with the driver's skin, very good preparation of the driver's skin, perhaps even slightly different electrodes that attach on to the skin rather than simply be in contact with it.
Hope this helps.
EDIT:
I am sorry, this is an unsalvageable situation. I have a couple of comments only,but I do not believe they will be very much of help.
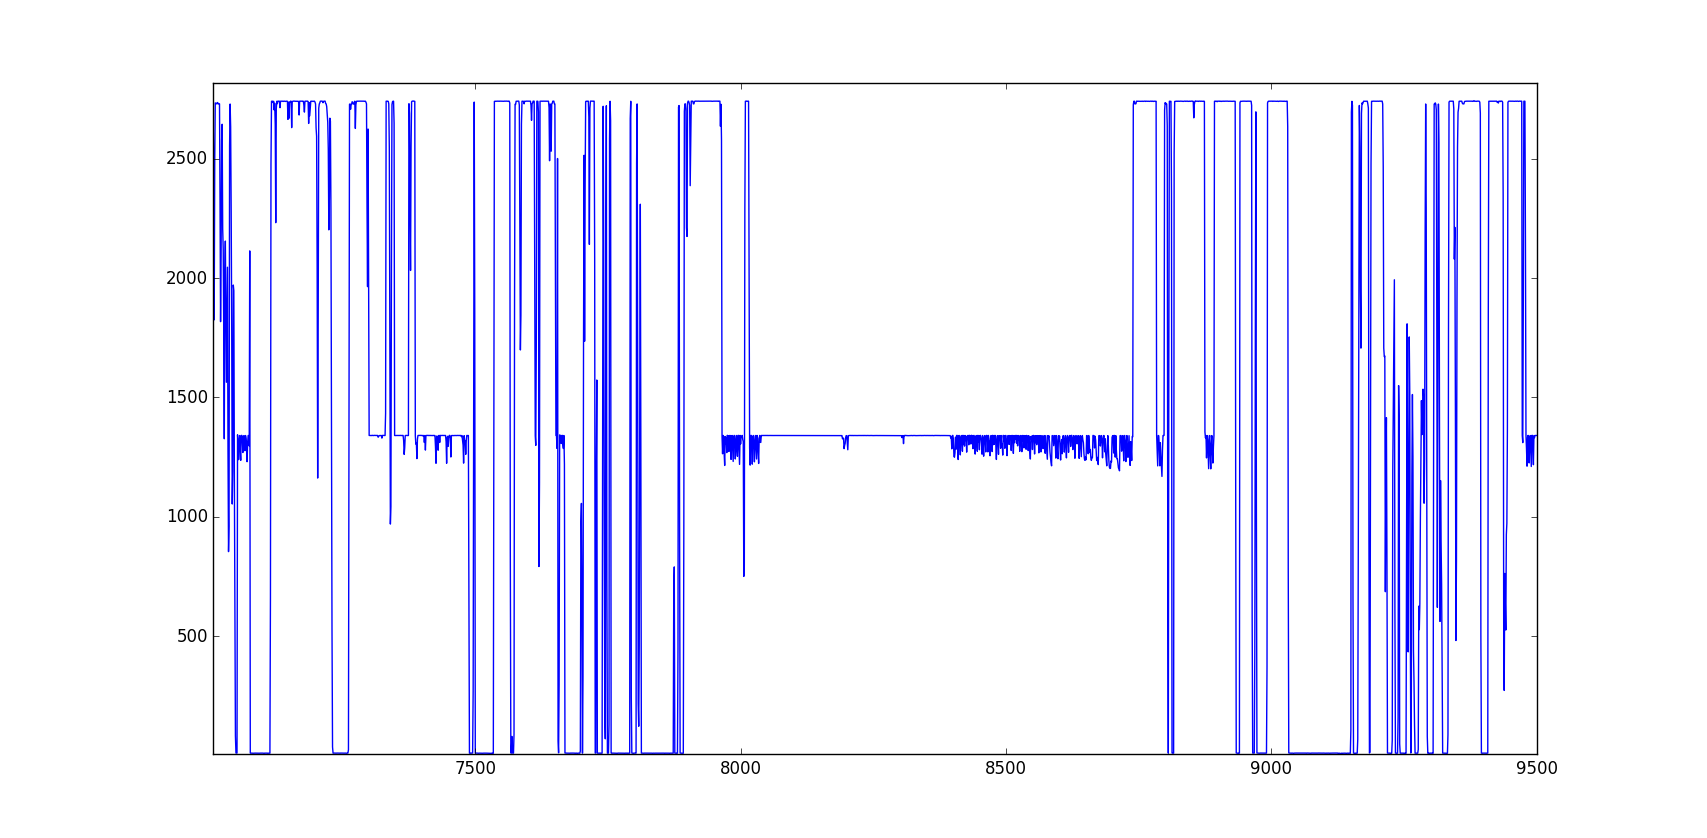
So, here is the full signal you shared (thank you, by the way):
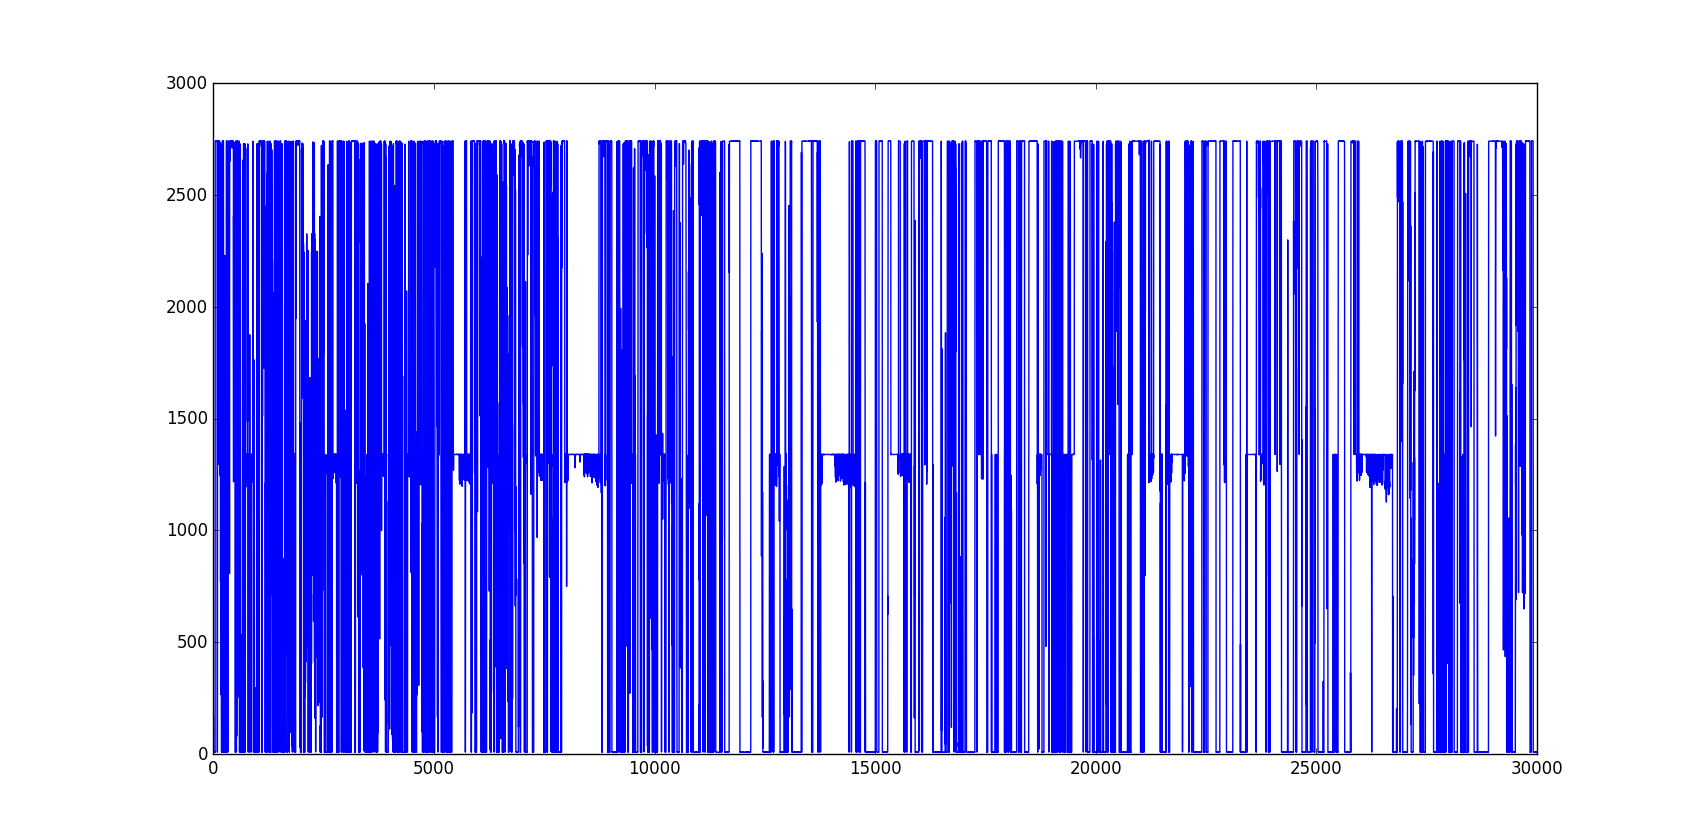
As you can see, there is nothing usable here. My perception is that the ECG amplifier is either saturating (because of induced voltage) or the contact with all three electrodes is not stable. If you notice a Holter monitor, which is used to "catch" abnormal heart functioning wherever it may happen, you will see that the leads are as short as possible with the device being mounted ON the chest. If we were to use the same device in an application similar to yours, we would have to use shielded leads and make sure the pads are firmly attached on the body.
Going a bit closer, it almost looks like "reversed bits"
What I mean by this is: Say for instance, you created your own ECG circuit. So, take an off the shelf instrumentation amplifier, set the gain and then feed that to an "Arduino"ish type of board with some 10bit Analog To Digital (ADC) converter that establishes a serial like channel to a pc or stores values internally. Because you have 10bits (or more) and you would have to send two bytes over the wire (or store two bytes) you would have to decide if they are sent/stored/received/retrieved Big Endian or Little Endian.
So, when you read a binary file from the disk and you get the endianess wrong, your integer values, the levels recorded by the ADC, would look a little like this second figure right here. There are glimpses of what looks like a signal inter dispersed with wild swings from the minimum to the maximum value. Also, your "zero" is not at 0, but maybe you used just two ECG leads.
I am just leaving this here as a comment in case it is what is going on, though I doubt it.
If you look more closely, the signal is just all over the place:
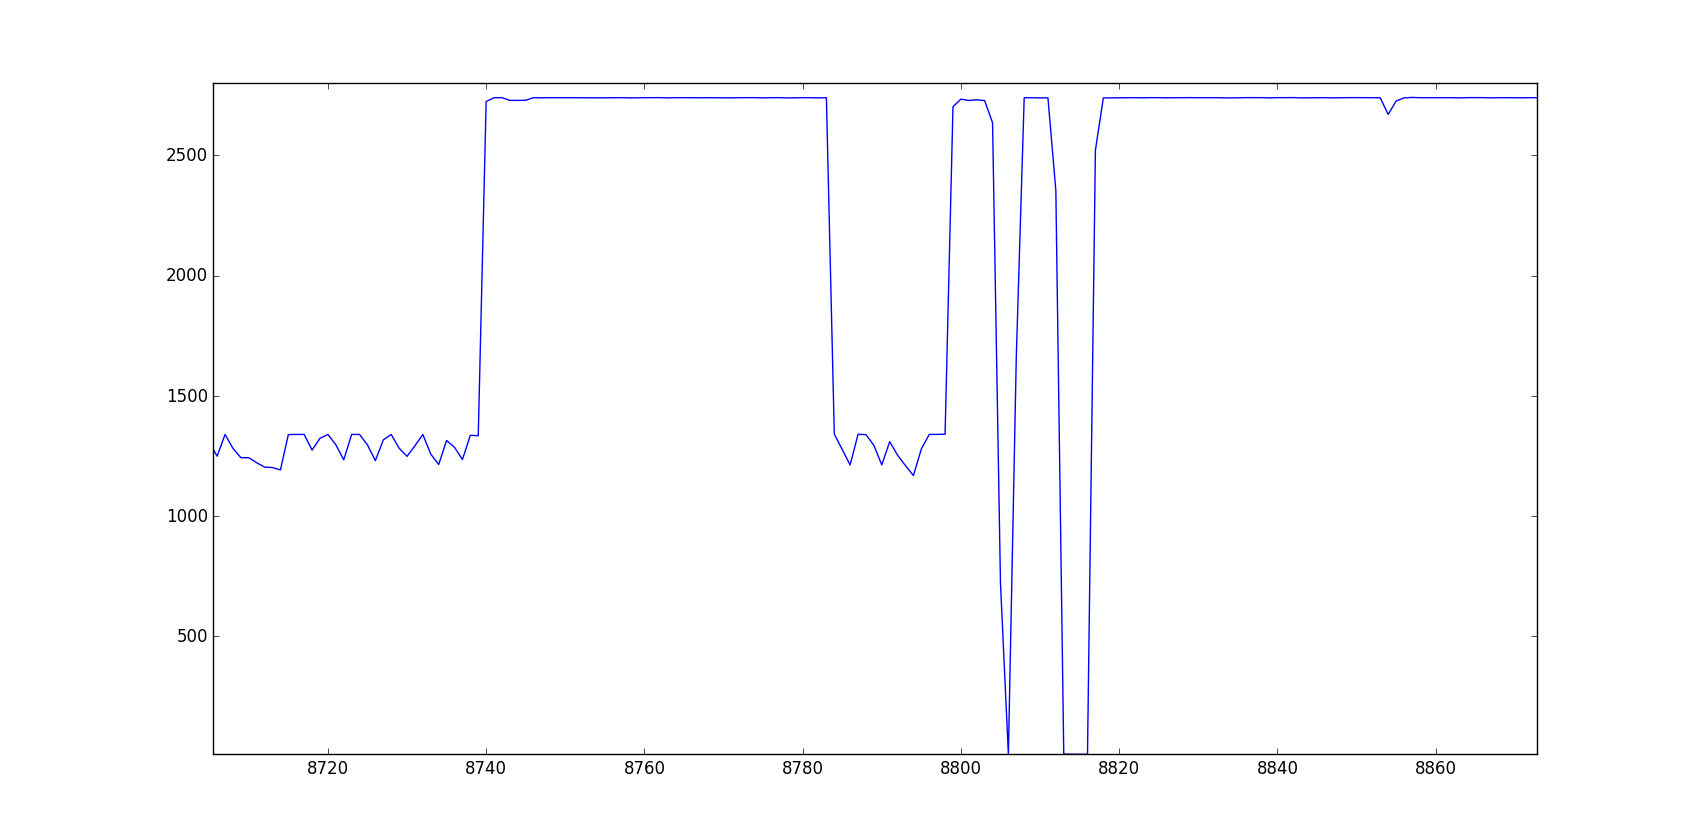
In fact, if you have telemetry from the rest of the car, try to plot together the RPM of the engine and the ECG signal that you have. What I would expect to see is the "density" of disturbances in the signal to correlate with the RPM of the engine, assuming that most of this interference is coming from the electrical system of the car (ignition, injection, throttle stepper motors, etc).
Hope this helps.

