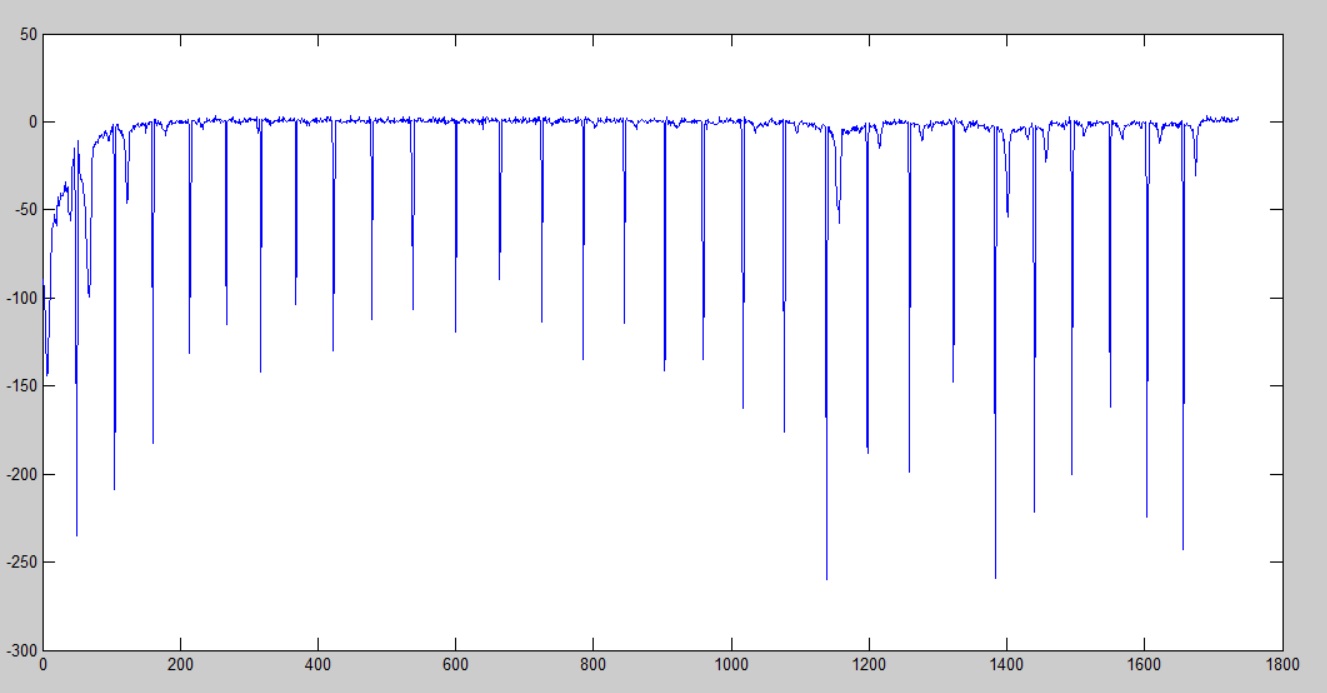
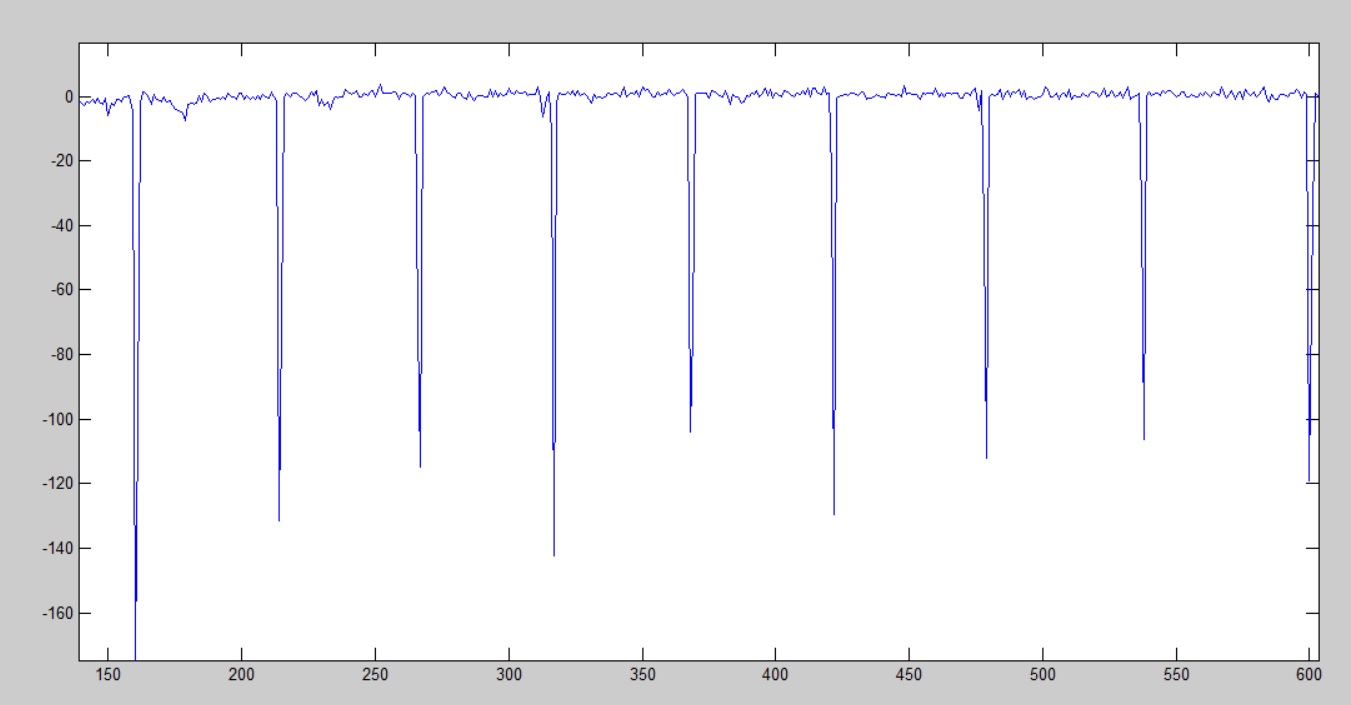
I'm a newbie and I have a few questions regarding ECG signal. Here is my plot of raw ECG signal with a sampling frequency 200Hz in Matlab.


Does it look good to you? Why is it flipped?
I'm a newbie and I have a few questions regarding ECG signal. Here is my plot of raw ECG signal with a sampling frequency 200Hz in Matlab.


Does it look good to you? Why is it flipped?
It's perfectly normal for the peaks to be at the bottom if that's what you're referring to. Even though on tv they are always on the top.
Here's an example from wikipedia. https://commons.wikimedia.org/wiki/File:Pulmonary_embolism_ECG.jpg
The ECG is indeed inverted. You can tell from the inverted p- and t- waves, which is not uncommon, but for your entire ECG to be inverted, that is quite rare. Try changing the polarity of your two leads, or multiply your signal by -1.
I don't think it is flipped. I think you should try to find out which of the ECG-leads you are looking at (I, II, V1, etc.)
It is not flipped. It is indicating a cardiac malfunction - deep Q wave...