1
$\begingroup$

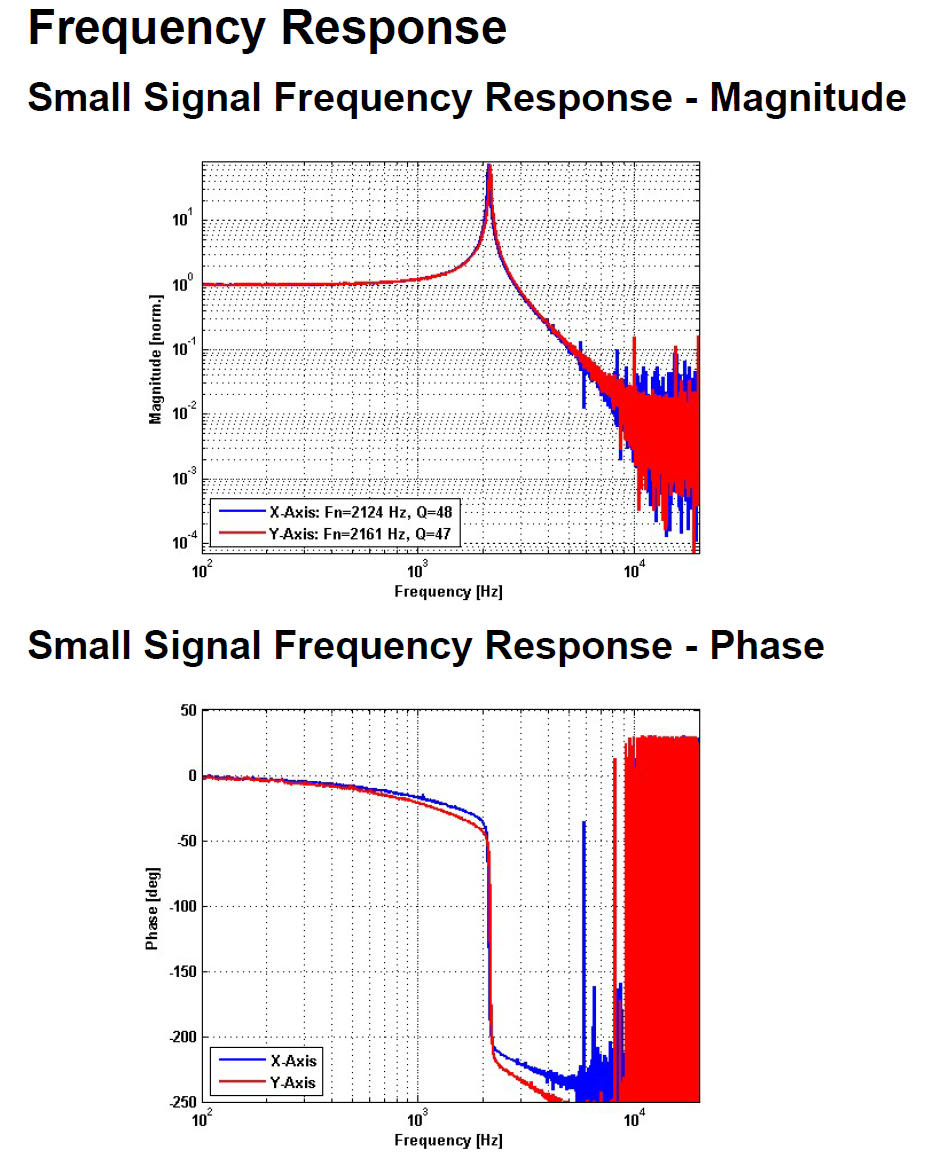
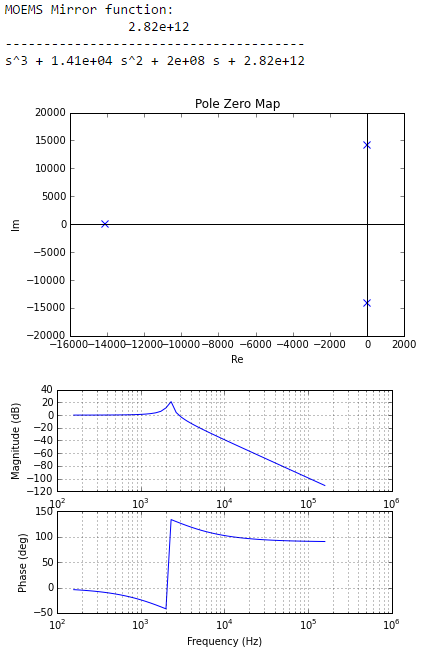
I'm trying to model the transfer function of a linear system (a MOEMS mirror) based on a datasheet plot of its response. I'm developing the model in the python-control model and I think that I've got the model pretty close, except that the Bode plot appears to wrap the phase response to keep it within $\pm 180^\circ$. My question is threefold:

  1. Is there a material difference between my model and what's in the datasheet with respect to the frequency wrapping?

  2. Is there a simple way in the python-control library to unwrap the plot

  3. Are there any other suggestions to improve my model?

Here is the response plots from the datasheet:

MOEMS mirror frequency response from datasheet

Here is my model:

My python-control model for the mirror

$\endgroup$

1 Answer 1

2
$\begingroup$

There is not really a difference between wrapped and unwrapped phase, it is mainly more visually pleasing when it is continues. The only way this could occur in an actual transfer function is when you would have two complex conjugate unstable poles and two complex conjugate stable zeroes with the same complex and real part, but the real part with opposite sign and the real part should be very small.

One way you could unwrap the phase is by splitting the transfer function up into multiple terms. Since multiplying two transfer functions, means adding their magnitude in dB and phase in degrees of radians. So you could first calculate the bode plot of the two complex conjugate poles (which should stay within 180°, unless it already wraps -180° to 180°) and then add the bode of the real pole to it. Or in this case you could look when the phase is bitter than 0°, in which case you subtract 360°.

In order to improve you model I would take a slightly better at the pole location, since their phase does not seem to drop instantly, so a small real part. There also might be a small delay ($e^{-Ts}$), since the phase of the data drops further than -270°.

$\endgroup$
3
  • $\begingroup$ Hmm I wonder if it's possible to do an e**(-Ts) in py-control. $\endgroup$
    – kjgregory
    Commented May 17, 2016 at 22:42
  • $\begingroup$ @kjgregory I am not familiar with pycontrol, but when plotting the bode of yoir model you could just subtract phase proportional to the frequency (because that is what delay does). But the frequency is in a logarithmic scale, so this would translate to exponential decrease in phase in the graph. $\endgroup$
    – fibonatic
    Commented May 17, 2016 at 22:49
  • $\begingroup$ Well this is just one component of my overall system. I will be adding feedback and compensation to the mix as well. $\endgroup$
    – kjgregory
    Commented May 17, 2016 at 22:51

Your Answer

By clicking “Post Your Answer”, you agree to our terms of service and acknowledge you have read our privacy policy.

Not the answer you're looking for? Browse other questions tagged or ask your own question.