improved formatting
Source Link
Gilles
  • 3.4k
  • 3
  • 23
  • 29

Phase wrapping in bodeBode plot

I'm trying to model the transfer function of a linear system (a MOEMS mirror) based on a datasheet plot of its response. I'm developing the model in the python-control model and I think that I've got the model pretty close, except that the bodeBode plot appears to wrap the phase response to keep it within +/- 180 degrees$\pm 180^\circ$. My question is threefold:

  1. Is there a material difference between my model and what's in the datasheet with respect to the frequency wrapping?

  2. Is there a simple way in the python-control library to unwrap the plot

  3. Are there any other suggestions to improve my model?

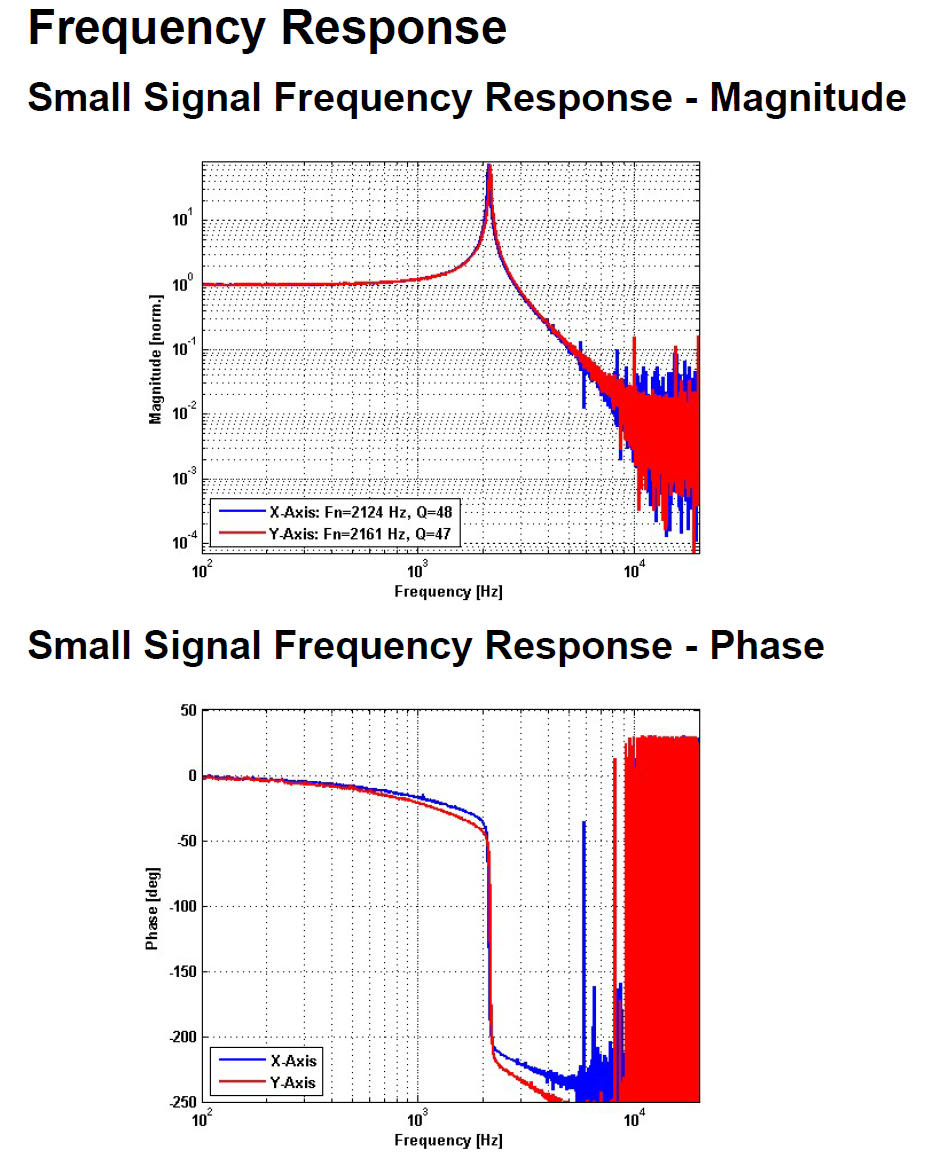
Here is the response plots from the datasheet:

MOEMS mirror frequency response from datasheet

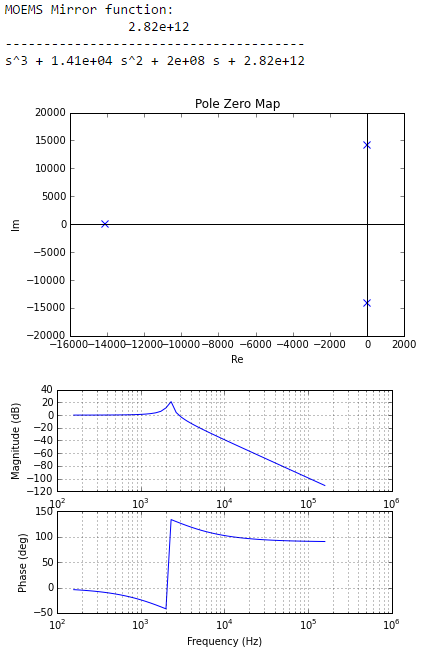
Here is my model:

My python-control model for the mirror

Phase wrapping in bode plot

I'm trying to model the transfer function of a linear system (a MOEMS mirror) based on a datasheet plot of its response. I'm developing the model in the python-control model and I think that I've got the model pretty close, except that the bode plot appears to wrap the phase response to keep it within +/- 180 degrees. My question is threefold:

  1. Is there a material difference between my model and what's in the datasheet with respect to the frequency wrapping?

  2. Is there a simple way in the python-control library to unwrap the plot

  3. Are there any other suggestions to improve my model?

Here is the response plots from the datasheet:

MOEMS mirror frequency response from datasheet

Here is my model:

My python-control model for the mirror

Phase wrapping in Bode plot

I'm trying to model the transfer function of a linear system (a MOEMS mirror) based on a datasheet plot of its response. I'm developing the model in the python-control model and I think that I've got the model pretty close, except that the Bode plot appears to wrap the phase response to keep it within $\pm 180^\circ$. My question is threefold:

  1. Is there a material difference between my model and what's in the datasheet with respect to the frequency wrapping?

  2. Is there a simple way in the python-control library to unwrap the plot

  3. Are there any other suggestions to improve my model?

Here is the response plots from the datasheet:

MOEMS mirror frequency response from datasheet

Here is my model:

My python-control model for the mirror

Source Link
kjgregory
  • 113
  • 1
  • 4

Phase wrapping in bode plot

I'm trying to model the transfer function of a linear system (a MOEMS mirror) based on a datasheet plot of its response. I'm developing the model in the python-control model and I think that I've got the model pretty close, except that the bode plot appears to wrap the phase response to keep it within +/- 180 degrees. My question is threefold:

  1. Is there a material difference between my model and what's in the datasheet with respect to the frequency wrapping?

  2. Is there a simple way in the python-control library to unwrap the plot

  3. Are there any other suggestions to improve my model?

Here is the response plots from the datasheet:

MOEMS mirror frequency response from datasheet

Here is my model:

My python-control model for the mirror