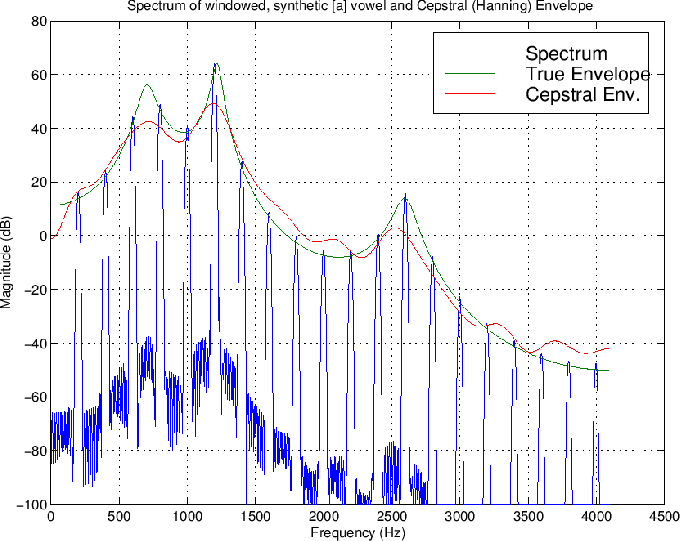
I need to compute the envelope of a spectrum in MATLAB. Is there a specific function that can do it? I saw the function
[yupper,ylower] = envelope(x,np,'peak')
but i'm not sure this one can be used in the frequency domain. The image below shows the result I would like to obtain (green line).
Any suggestion? Thank you.


[yupper,ylower] = envelope(x,np,'peak')or if possible share its code, most probably you can get the green curve by changing the order of cepstrum env. calculation. $\endgroup$