1
$\begingroup$

i have a 192kHz sampled signal that has been measured using an ultrasound MEMS microphone and i want to visualize the spectral envelope. I have found here and here ideas on how to do it (mainly "peak picking in the power spectrum followed by parabolic interpolation"). My data looks like this: enter image description here
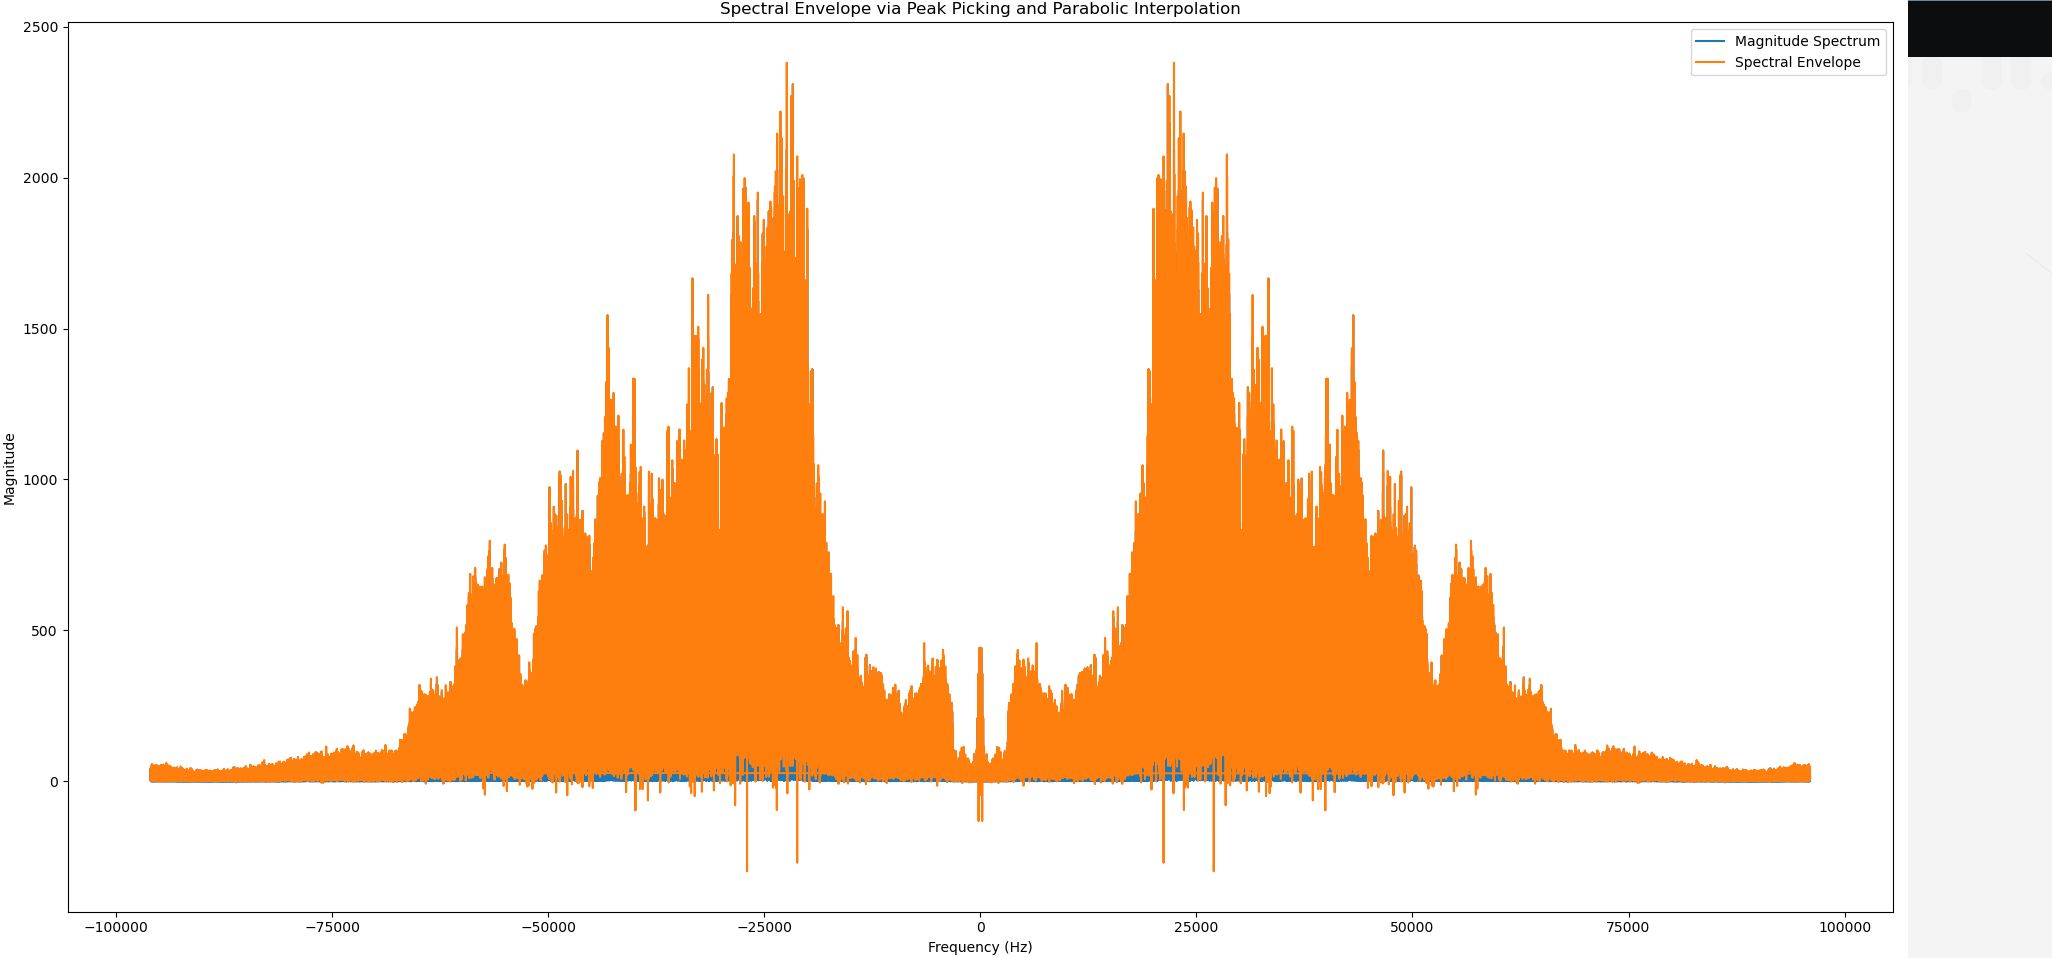
This is not a good envelope. Can someone explain how to set the parameters correct to receive a proper envelope?

$\endgroup$
2
  • 1
    $\begingroup$ you'd need to show us what your magnitude spectrum looks like; it's hidden by your orange plot, completely. Also, what's not "good" about it? We can't know what you're looking for. What is the quality in a "spectral envelope" that you're looking for? $\endgroup$ Commented Dec 6, 2023 at 16:01
  • $\begingroup$ Since you only want to visualize, most of the time a smooth(x) on your signal would work well, considering averaging the energy spectrum preserves the total energy. Any other non-linear operation to highlight the peaks would mess with this simple operation. $\endgroup$
    – Brethlosze
    Commented Dec 9, 2023 at 3:07

0

Your Answer

By clicking “Post Your Answer”, you agree to our terms of service and acknowledge you have read our privacy policy.

Browse other questions tagged or ask your own question.