1
$\begingroup$

I am trying to implement AM demodulation in Matlab by taking advantage of the fact that in the frequency domain, the spectrum of the modulated signal is shifted by the frequency of the carrier.

I wrote code in Matlab that shifts the componenets back and does an inverse Fourier Transform to reconstruct the signal. The code seems to work well enough for a cosine with a cosine envelope, but if I try using a cosine to modulate a sine, I do not get the correct signal, and my Fourier specturm seems to have both real and imaginary components, which has me buffled: If the Fourier transform should be the spectrum of the envelope just shifted, and the envelope is a sine, shouldn't the transform be pure imaginary?

I attach my code along with a graph that shows my resultsAny help is appericiated in getting to the bottom of this.

clear all

f = 50; % Message Frequency
fc = 1000; % Carrier Frequency
Fs = 5000; % Sample Frequency
t = (0:(1/Fs):1); 

L = length(t);

s = sin(2*pi*f*t); % Message Signal

mod = s.*cos(2*pi*fc*t); % Modulated Signal

% Fourier Transform
a = fftshift(fft(mod));
w = Fs*(-(L/2):(L/2-1))/Fs; % Frequency axis

%% Perform complex demodulation:

% Zero all components less than the carrier frequency
a_zeroes = a;
a_zeroes(w<fc) = 0;

% Move the spectrum back by the carrier circularly to effectivly shift
% back:
a_shifted = circshift(a_zeroes,[0,-fc]);
% Reflect 
a_reflected = fliplr(a_shifted);

a_demoded = a_shifted;
a_demoded(1:floor(length(a_demoded)/2)) = a_reflected(1:floor(length(a_demoded)/2));

% Take inverse fft
demoded = ifft(ifftshift(((a_demoded))));

%% Plot fft and demodulated vs. modulated
figure;
subplot(3,1,1); plot(w,real(a),'r','linewidth',4); hold on; plot(w,imag(a),'g','linewidth',2); title('Original FFT'); 
subplot(3,1,2); plot(w,real(a_demoded),'r','linewidth',4); hold on; plot(w,imag(a_demoded),'g','linewidth',2); title('Shifted FFT');
subplot(3,1,3); plot(t,s); hold on; plot(t, (sqrt(2*pi)).*(demoded)); title('Original Vs. Demodulated');

Here you can see the original FFT. I reconstructed the envelope's spectrum, then did an inverse FFT, but the result has less amplitude and is out of phase.

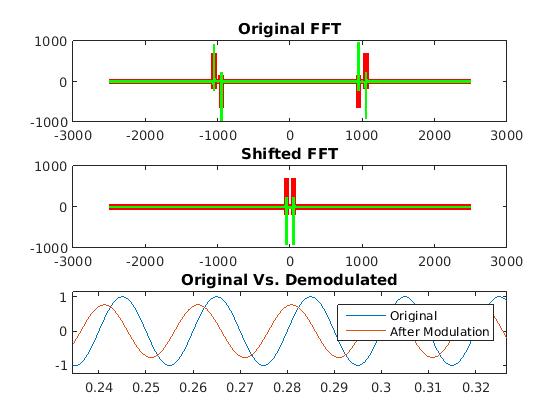
Red is the real part, Green is the imaginary part. The signal

$\endgroup$

2 Answers 2

0
$\begingroup$

As you can see from your "Original FFT" plot, the real part of the FFT has even symmetry and the imaginary part has odd symmetry. When you zero out the lower sidebands, shift, and re-create the negative frequencies, you're forcing the FFT to have even symmetry (look at your "shifted FFT") plot. The signal you re-created corresponds to a cosine; this is what you get in the "Original vs Demodulated" plot, where the recovered signal is 90 degrees out of phase with the original.

The more common approach to demodulating in the frequency domain is as follows:

  1. Zero out the negative frequencies. This is usually accomplished with the Hilbert transform. A signal $s(t)+j\hat s(t)$, where $\hat s(t)$ is the Hilbert transform of $s(t)$, is called an "analytic signal" and its spectrum only exists for positive frequencies.

  2. Shift the spectrum back to baseband by multiplying the analytic signal with a complex exponential of frequency equal to $-f_c$.

The result of this process is the "complex envelope" which, despite its name, is real in the case of DSB-SC modulation of a single sinusoid.

$\endgroup$
0
$\begingroup$

To add my two cents to Maz's useful answer, once you've shifted the positive-frequency-only complex-valued time signal down to be centered at zero Hz you have what is often called a "complex baseband" signal. If the oscillator you used for the freq down-conversion is exactly in phase with the received signal's carrier sine wave then you can merely take the real part of the complex baseband signal samples as your desired demodulated AM result.

However, if the oscillator used for the freq down-conversion is not exactly in phase with the received signal's carrier (which is the normal situation) then your desired AM demodulated signal will be the magnitude of the complex-valued complex baseband signal's samples. If the original transmitted signal was a commercial AM broadcast RF signal, the computed magnitude samples will be riding on a DC bias which you may, or may not, want to pass through a DC blocking filter to make that sequence's average value close to zero amplitude.

As an alternative, you could perform AM demodulation the way the radio in your bedroom does it. Compute the absolute values of your received RF AM signal and pass those always-positive samples through a digital lowpass filter (whose passband is the roughly zero to 4 or 5 kHz) to obtain your desired AM demodulated signal. This scheme won't work as well as Mbaz's method but it may work well enough for your purposes.

$\endgroup$

Your Answer

By clicking “Post Your Answer”, you agree to our terms of service and acknowledge you have read our privacy policy.

Not the answer you're looking for? Browse other questions tagged or ask your own question.