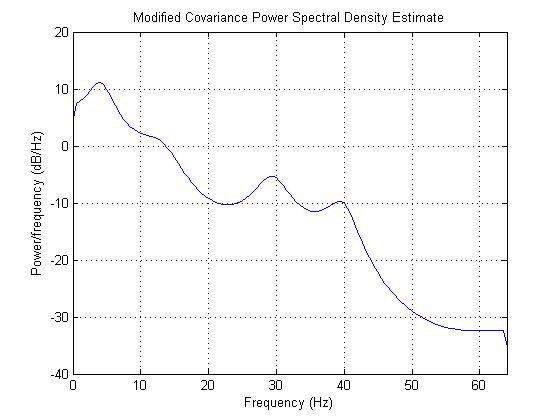
How do we interpret a power spectral density plot. I have used modified covariance and burg methods and plotted using MATLAB. What does the peaks at some frequencies suggest? and what is the difference between positive and negative power in the graph? how do we know that which frequencies variations are strong and at which frequencies variations are weak.. can anyone help me please..
Thanks

