1
$\begingroup$

From signal theory we know that a very useful representation of some power signals is that of its power spectral density, whose curve represents how the total power of the signal is distributed at all frequencies. For instance, it is a couple of dirac pulses for a sine wave of frequency f0 because its power is concentrated at frequencies f0 and -f0.

But in some different situations I have seen that we often use not exactly the power spectral density representation, but the power representation.

EXAMPLE 1: Measurements with Spectrum Analyzer

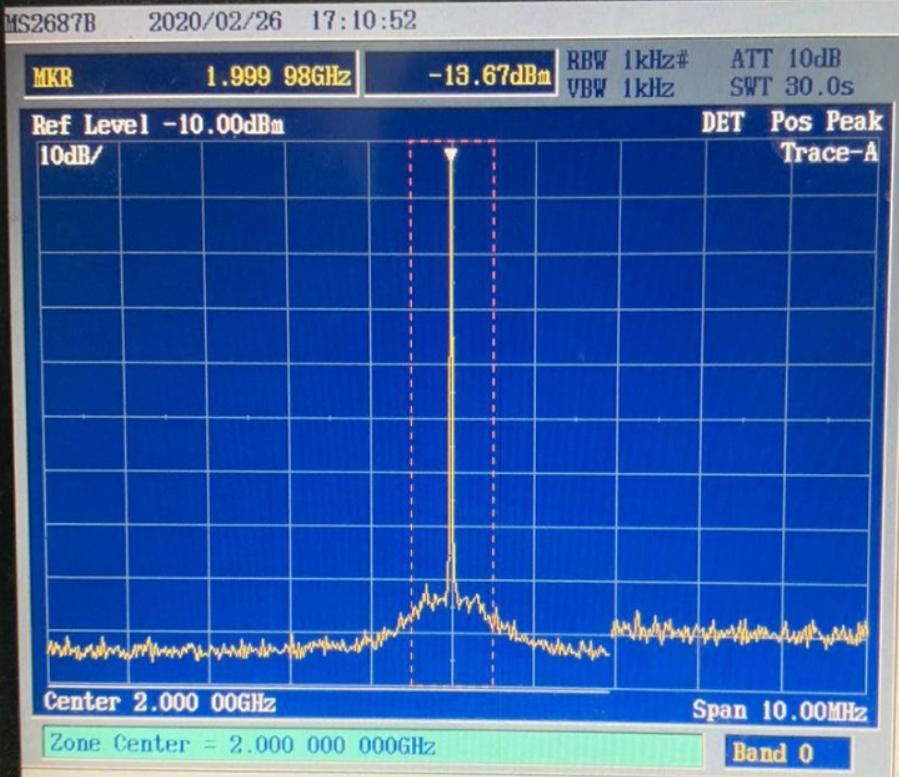
If we use a spectrum analyzer, we see in abscissa the different frequencies, and in ordinate the power of the signal. For instance, this is a measurement I have done:

enter image description here

I have sent to the instrument a sine wave of -13dBm of power, and its total power is represented in ordinate of the peak. What does it mean from a math point of view?

I think this representation has no sense: the ordinate should be the power spectral density, not its integral in a neighborhood around the frequency considered!

Example 2: simulink

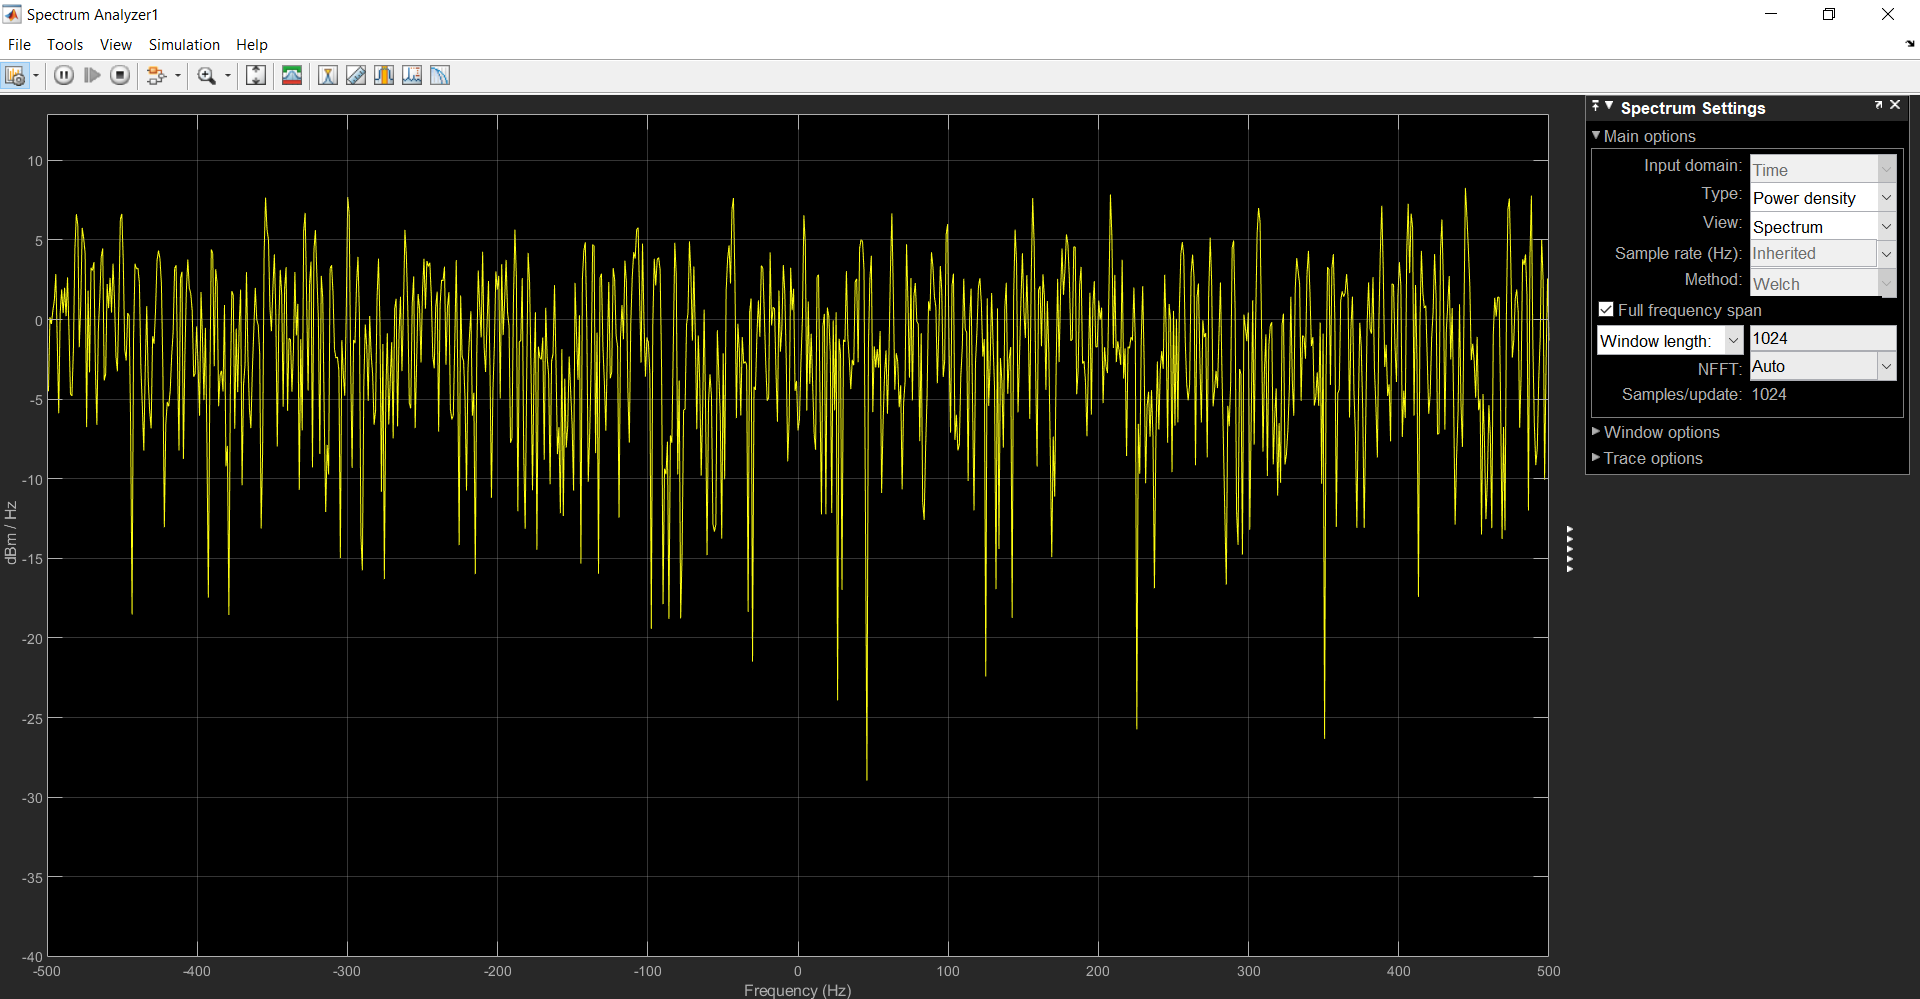
This is the representation of the power spectral density of a certain noise:

enter image description here

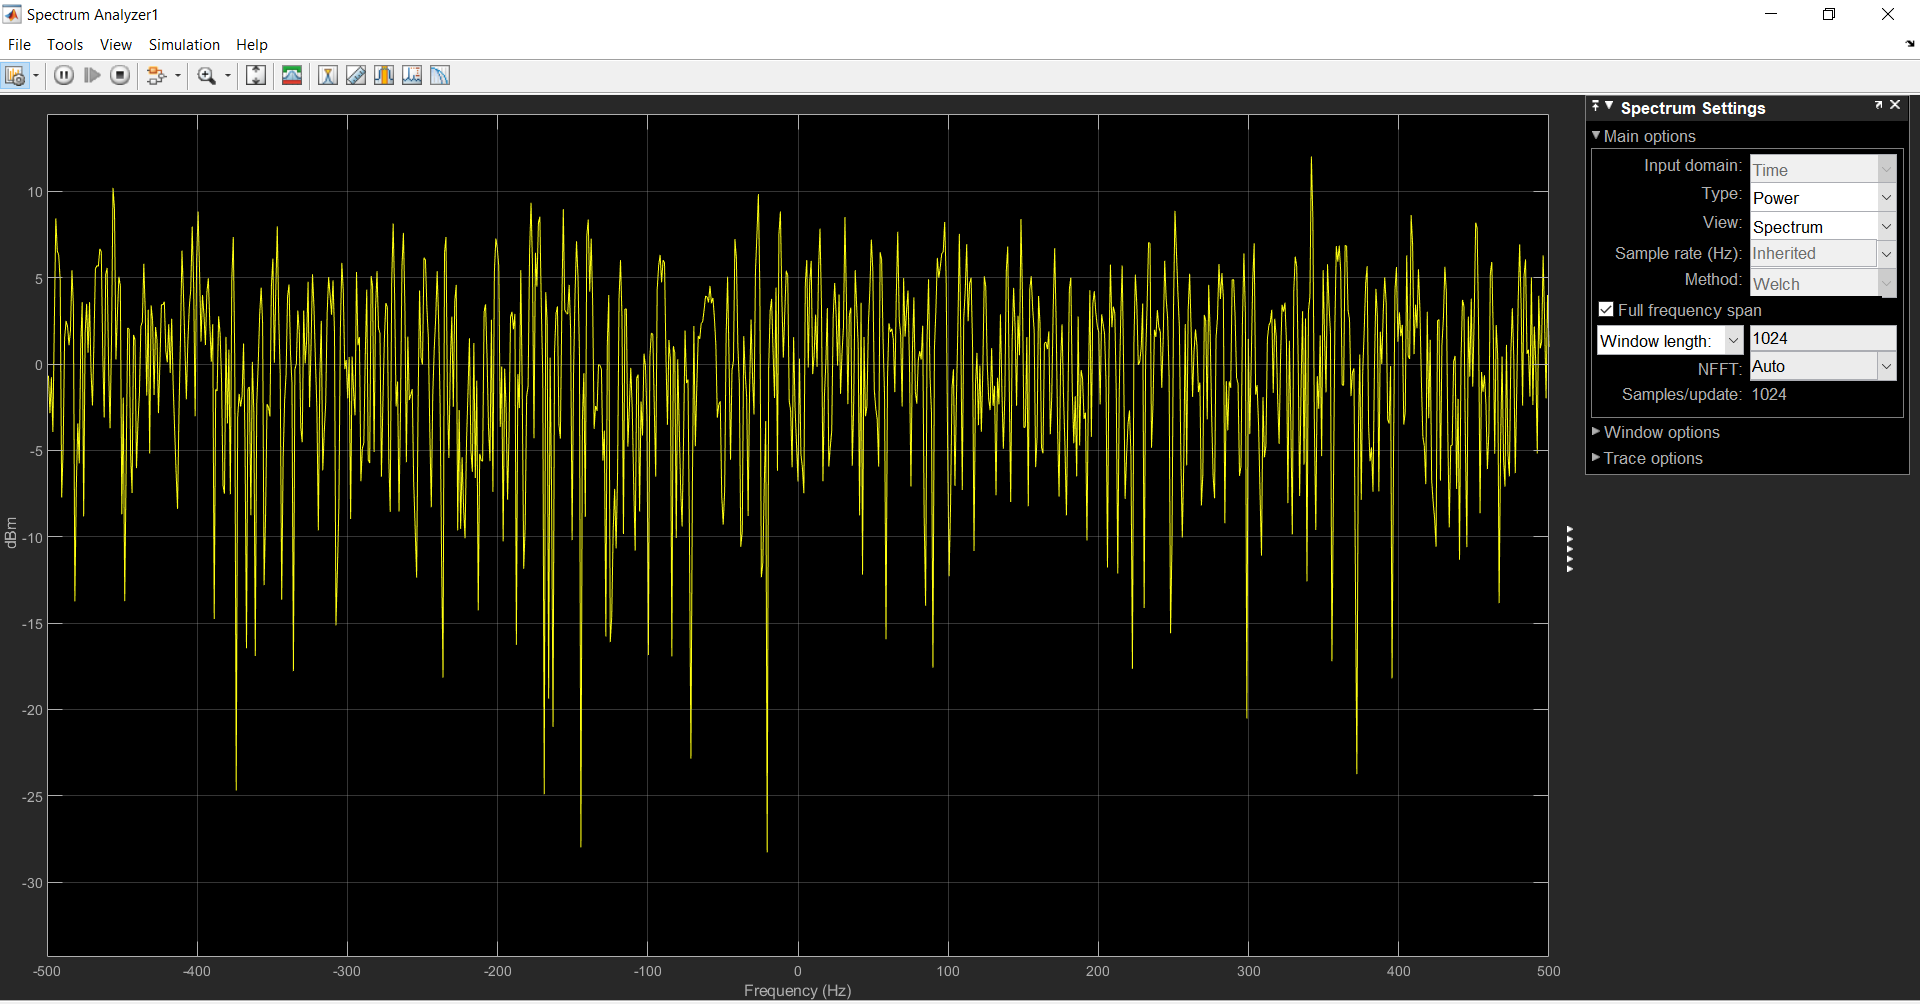
This is the representation of the power of the same noise:

enter image description here

What is the link between them? Power should not be function of frequency (it is the integral on all frequencies of power spectral density), power spectral density yes! So what does it mean that we see the "power spectrum"?

$\endgroup$
2

2 Answers 2

1
$\begingroup$

What is the link between them? Power should not be function of frequency (it is the integral on all frequencies of power spectral density)

As far as a Spectrum Analyzer is concerned, to display the power spectrum in dBm, what it does it to take the FFT and compute square of magnitude $P_n = 20 \times log_{10}(|X(f_n)|^2*1000/100)$ with $f_n$ being the discrete frequencies separated by resolution bandwidth (see it is set to 1kHz for this case). I multiplied by 1000 since unit is in dBm and I divided by 100 because to get to power, I have to pass voltage $X(f_n)$ through a resistance of $50\Omega$. ($\frac{V^2}{2R}$).

To derive power spectral density from power spectrum, I am sure it is just dividing power in each bin by RBW. $P_n/f_{rbw}$. Though I am not very sure whether it is the (dBm value divided by rbw) or (dBm value of linear power value divided by rbw).

I think this representation has no sense: the ordinate should be the power spectral density, not its integral in a neighborhood around the frequency considered

Well, in this case it is the latter. I think that is how all commercial spectrum analyzers represent spectrum (if you choose units as dBm or Watts). The comment by MBaz correctly mentions this.

Note - The final plot will be slightly different because your FFT size output will be different from number of trace points used to display on the screen. In order to combine several FFT points into 1 trace point on screen, a detector logic is used.

$\endgroup$
0
$\begingroup$

In addition to the resolution bandwidth fact, i think power spectral density has something to do with stochastic signals. If your signal is predetermined, you have to work with power instead of power spectral density. One good example is the very sine wave you mentioned. The mean power for that signal in its main frequency can be defined using the integral you mentioned. Also, keep in mind that instruments have their own ways of measuring power and they may even be calibrated to show you the total power in the corresponding positive frequency.

$\endgroup$

Your Answer

By clicking “Post Your Answer”, you agree to our terms of service and acknowledge you have read our privacy policy.