I'm currently working on a project that involves using an electron gun and it would be really nice to know the spot shape of the electrons coming out of the gun (the frequency of electrons at some x,y away from the center of the beam). Our current assumption is that the beam's spot shape is somewhat gaussian.
We have a picoammeter hooked up to a detector that outputs that current corresponding to the number of electrons that hit the detector. The detector is circular with some radius, R.
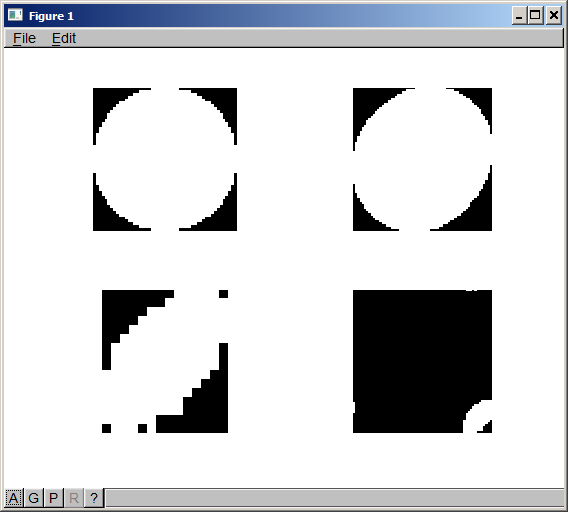
If I'm not mistaken, sweeping the beam and recording readings from the picoammeter will result in an matrix that is the convolution of the beam spot shape and a 2D step function that's 0 outside of R and non-zero inside R. I have looked through a few previous questions about deconvolutions related to images with a gaussian blur and it seems like this is very similar except the function is a step function instead of a gaussian.
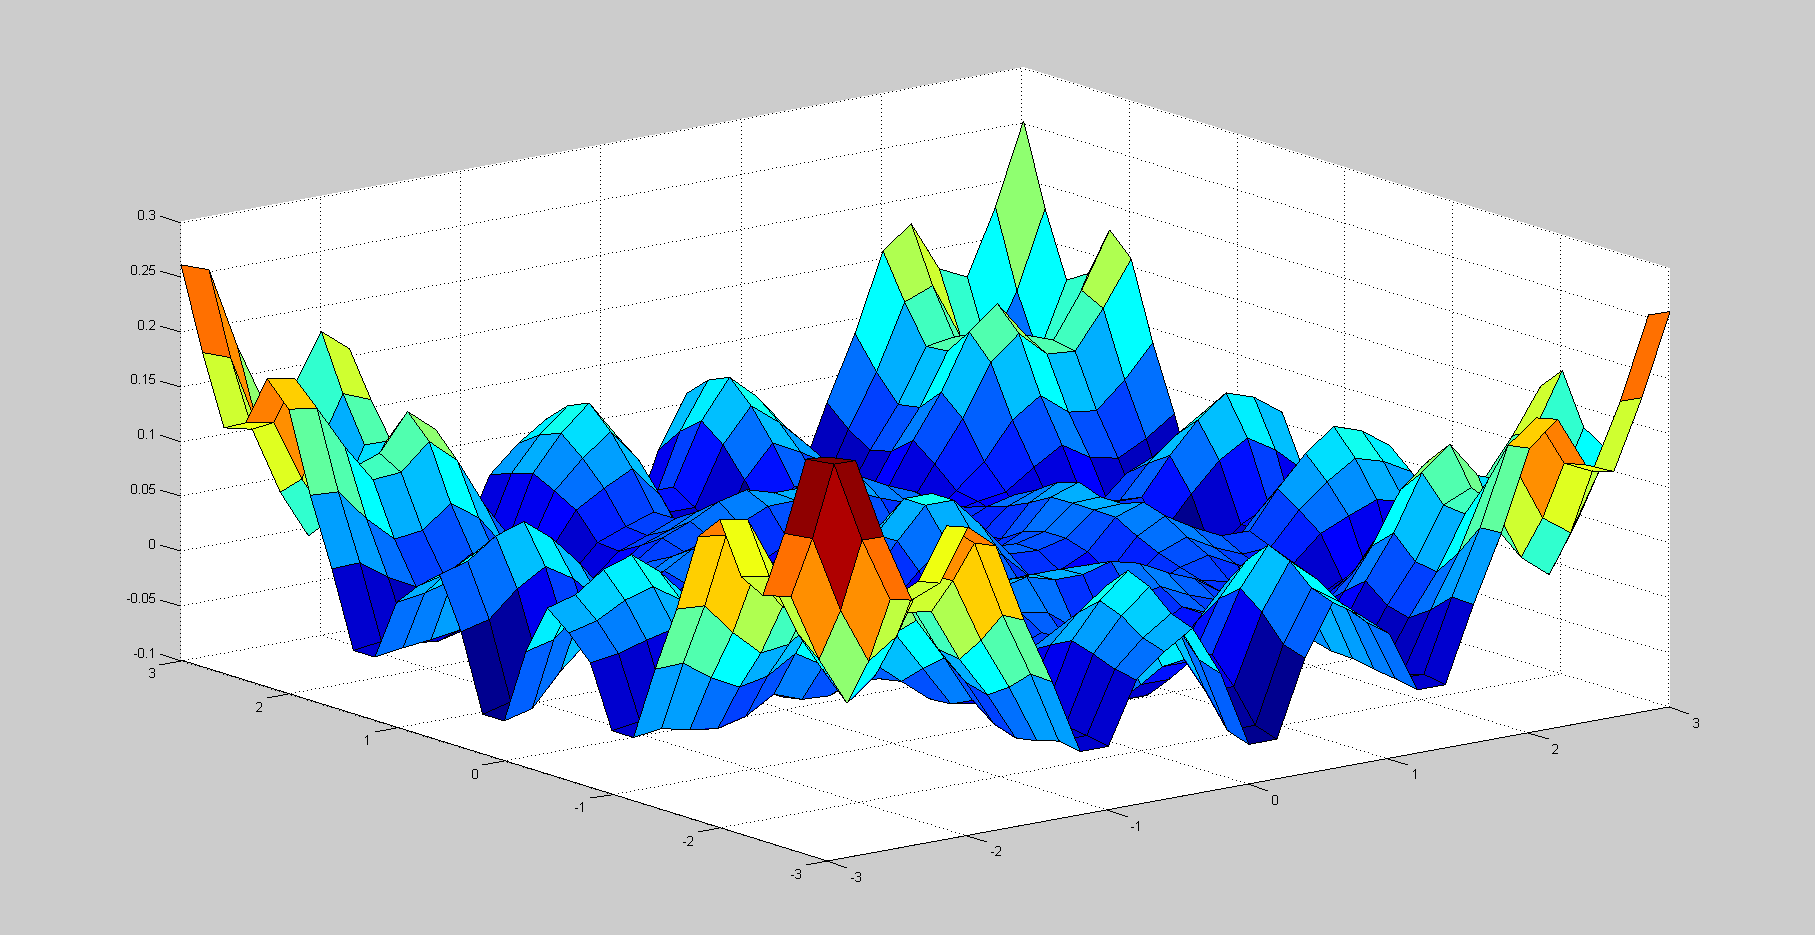
I have tried using Matlab's conv2, FFT2, and iFFT2 functions to get the deconvolution as this thread suggests, but it produces something looking like this:

The code that produced this is:
mu = [0 0];
Sigma = [1 0; 0 1];
x = -3:.2:3;
[X1,X2] = meshgrid(x,x);
F = mvnpdf([X1(:) X2(:)],mu,Sigma);
F = reshape(F,length(x),length(x));
for i=1:31
    for j=1:31
        if x1(i)^2+x2(i)^2 >= 4
            circ(i,j)=0;
        else
            circ(i,j)=1;
        end
    end
end
conv = conv2(F,circ,'same');
D = ifft2( fft2(conv) ./ fft2(circ) );
surf(x1,x2,D);
Is there something inherently wrong with trying to deconvolves a step function? Also, I tried using the full convolution, but that seemed to produce an even weirder deconvolution...
Am I just going about this the wrong way? (I've included python because I would prefer to use python if a solution exists, but matlab is fine too)

