0
$\begingroup$

I'm going through some conceptual questions about windowing signals. I came across the following:

Assume a sinusoidal signal - under which conditions will windowing with a rectangular window intime always lead oscillations in the spectrum? And under which conditions not?

My own answer

We multiply a $\sin(t)$ with a rect window in the time domain. This becomes a convolution of an impulse and a $\text{sinc}$ function in the frequency domain.

If the signal is in continuous time, then the spectrum of the signal is not periodic and we will only get one convolution of an impulse and a $\text{sinc}$ function. So some oscillations in frequency domain, but not periodic.

If the signal is in discrete time (we have sampled it), then the spectrum of the signal is periodic. Thus, we will get infinitely many convolutions of an impulse with $\text{sinc}$ function. So forever oscillating spectrum.

And I was wondering if this is the answer they want. Because it feels like the question wants me to look at some properties of the window and the sine-wave. So my question is am I answering this conceptual question correctly?

Edit

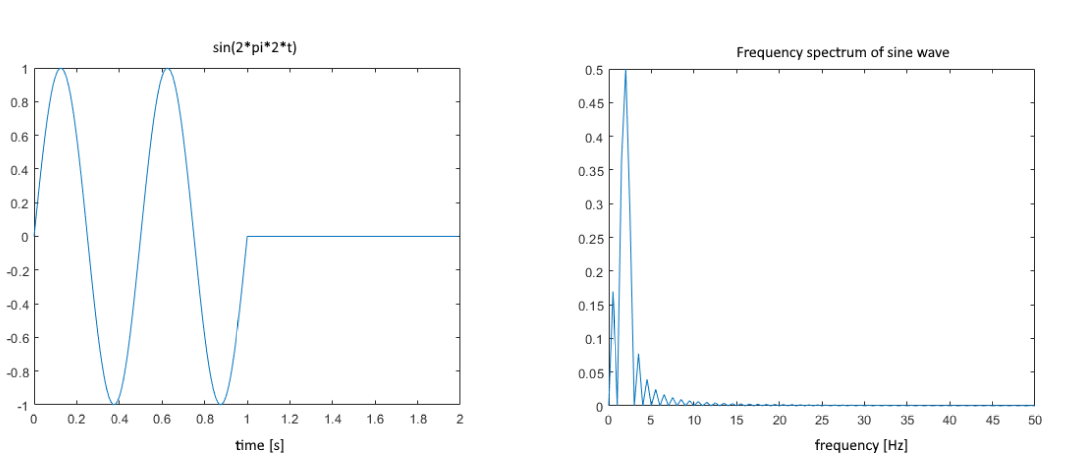
I tried to write some MATLAB code to check with Richard's answer but I can't seem to get the right thing:

enter image description here

fs = 100;
t = 0:1/fs:2-1/fs;
x = sin(2*pi*t*2);
k = [ones(100,1);zeros(100,1)];
x2 = x'.*k;
plot(t,x2)
X2 = fft(x2);

%Plotting
P2 = abs(X2/200);
P1 = P2(1:200/2+1);
P1(2:end-1) = 2*P1(2:end-1);
f = fs*(0:(200/2))/200;
plot(f,P1)
$\endgroup$

1 Answer 1

1
$\begingroup$

The question, as written, is ambiguous. Instead of "sinusoidal signal" the question's author should have written either "continuous sinusoidal signal" or "discrete sinusoidal signal".

For a windowed continuous sinusoidal signal or a discrete sinusoidal signal containing a noninteger number of cycles, the spectrum will have a main lobe and oscillating sidelobes. For a real-valued discrete sinusoidal signal containing exactly an integer number of cycles, the spectrum will have only two nonzero valued spectral samples (no main lobe and no oscillating sidelobes).

$\endgroup$
2
  • $\begingroup$ Hey Richard thank you for your answer. I have updated the question, because I can't seem to replicate what you describe. I have windowed a sine-wave after 2 cycles, but the spectrum doesn't look like you describe it. Could you please take a look at it? $\endgroup$
    – Carl
    Commented Dec 1, 2021 at 10:40
  • 1
    $\begingroup$ @Carl You plotted the positive-frequency range of the spectral magnitudes of two cycles of a sine wave appended with 100 zero-valued samples. Eliminate those zero-valued samples by changing your 'x2 = x'.*k;' command to 'x2 = x(1:100);' to generate EXACTLY two cycles of a sine wave. Then, right after the 'fft' command, plot using 'plot(abs(X2), 'bo')' to see two nonzero spectral magnitude samples. Carl, continue your software modeling. That's a super-good way to learn. $\endgroup$ Commented Dec 4, 2021 at 8:16

Your Answer

By clicking “Post Your Answer”, you agree to our terms of service and acknowledge you have read our privacy policy.

Not the answer you're looking for? Browse other questions tagged or ask your own question.