0
$\begingroup$

Here is the code I use to plot a function in frequency domain in Matlab:

    dt = 1/10000; % sampling rate
    et = 0.1; % end of the interval
    t = 0:dt:et; % sampling range
    y = 2+sin(2.*pi.*50.*t)+18.*sin(2.*pi.*90.*t)+6.*sin(2.*pi.*180.*t); %     sample the signal
    subplot(2,1,1); % first of two plots
    plot(t,y); grid on % plot with grid
    xlabel('Time (s)'); % time expressed in seconds
    ylabel('Amplitude'); % amplitude as function of time
    Y = fft(y); % compute Fourier transform
    n = size(y,2)/2; % 2nd half are complex conjugates
    amp_spec = abs(Y)/n; % absolute value and normalize
    subplot(2,1,2); % second of two plots
    freq = (0:100)/(2*n*dt); % abscissa viewing window
    stem(freq,amp_spec(1:101)); grid on % plot amplitude spectrum
    xlabel('Frequency (Hz)'); % 1 Herz = number of cycles/second
    ylabel('Amplitude'); % amplitude as function of frequency

The problem is, when I zoom in my graph I don't see peaks exactly on 50Hz, 90Hz and 180Hz.

What did I do wrong in my code?

$\endgroup$

2 Answers 2

1
$\begingroup$

The Discrete Fourier transform doesn't actually decompose a signal into a sum of sinusoids it was composed from. The DFT projects the signal onto a specific set of discrete sinusoids known as Fourier basis. Sinusoids used to compose the signal may or may not coincide with the DFT basis.

Here's another way of looking at it. The DFT deals with periodic functions. If you plot 3-4 periods of your signal interval, you'll see it doesn't look like a sum of pure sinusoids, and has discontinuities - if sinusoids it was composed from don't coincide with a Fourier basis.

$\endgroup$
2
  • 1
    $\begingroup$ I think you mean specifically DFT X[k] of x[n]. Because otherwise DTFT $X(e^{j\omega})$ would compute whatever frequency there is in the discrete signal in exactness, due to its continuous frequency variable. $\endgroup$
    – Fat32
    Commented Apr 8, 2015 at 1:01
  • 1
    $\begingroup$ Yes, indeed. Corrected. $\endgroup$ Commented Apr 8, 2015 at 1:58
0
$\begingroup$

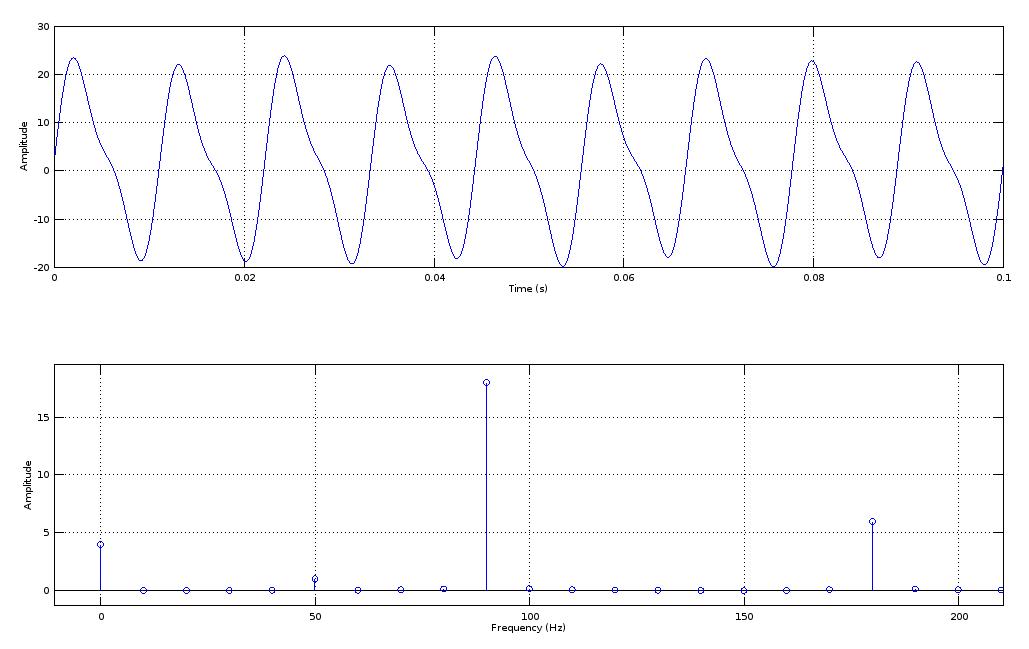
Well it does in Octave, (obtained by pasting your code, unmodified into a script file):

enter image description here

$\endgroup$

Your Answer

By clicking “Post Your Answer”, you agree to our terms of service and acknowledge you have read our privacy policy.

Not the answer you're looking for? Browse other questions tagged or ask your own question.