0
$\begingroup$

As many of us have noticed, last two months I am working on GMSK modulation and demodulation design. Before continuing my research, I want to be sure I chose the correct oversampling ratio ( how many zeros should I add inside my signal before convolution with the Gaussian filter?). How to choose the correct oversampling ratio for nonlinear modulation?

I know, that when I choose the oversampling factor (ovs), it must hold (according to Nyquist, and thus to avoid aliasing) Ts<<T ( T- symbol time, Ts - sampling time). The oversampling factor cannot be too small.

I have "understood" from Mr Dan Boschen's explanation the following: for case, BT = 0.25 ovs=8 is sufficient for not introducing aliasing but also acceptable from a complexity point of view (not too large).

BUT how should I determine that this oversampling ratio is sufficient? Should it be calculated somehow? Should I implement an additional process?

I am sorry if it is the stupidest question you have ever read here...but I want understand this process.

$\endgroup$

1 Answer 1

3
$\begingroup$

The referenced post does not imply that 8 samples per symbol are required, that is only what was used in order to show the extended spectrum as copied below:
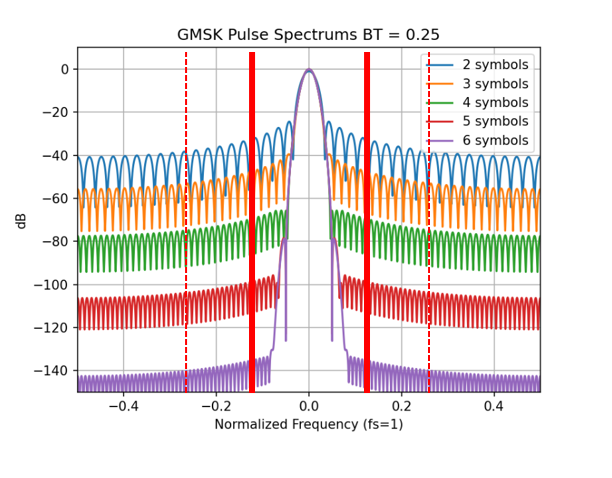
GMSK for BT=0.25

What I have also included in this copy of the plot are additional lines showing what would occur if we decreased the number of samples per symbol. At 8 samples per symbol, the normalized frequency shown extends from $f=-0.5$ to $f=+0.5$ corresponding to $\pm f_s/2$ where $f_s$ is the sampling rate, and $f_s/2$ is the "Nyquist boundary" beyond which spectral aliasing will occur. We see how the sidelobes of the spectrum continue to decrease as we approach the Nyquist boundary, so the determination of how many samples per symbol (which set the sampling rate) is set on how much aliasing we will tolerate, and as explained in other posts, allowing for simplification of subsequent filtering such as the analog reconstruction filter after the D/A converter.

As shown, the actual spectral levels in the plot in proximity to $f = -0.5$ and $f=0.5$ include the aliasing so would be raised slightly at these locations than if we had extended the number of samples even further. With a pulse duration of 4 symbols the overall distortion is nearly -80 dB, so in most cases this would be of no concern.

I have also drawn in additional bold lines showing where the Nyquist boundary would be if we were to decrease the sampling rate to just 2 samples per symbol (the new sampling rate would be at the dashed lines indicated by $f=\pm 0.25$ corresponding to decreasing 8 samples per symbol by 4. The Nyquist boundary would then occur at $f=\pm 0.125$ and the spectrum as shown just past this would fold back onto the main passband in the center, contributing additional distortion to our signal. With a symbol duration of 4 symbols, we would have spectral folding at approximately -70 dB (also likely of no consequence).

More significantly, the waveform will repeat spectrally at every multiple of the new sampling rate (in this case at $f=\pm 0.25$, $f=\pm 0.5$, $f=\pm 0.75$, etc..) thus imposing much tighter requirements on the D/A converter or subsequent digital interpolation filters if used. In this case, simplifying this filtering would be the prime consideration in choosing the number of samples per symbol, balanced with minimizing the digital sampling rate leading to lower power and lower complexity.

Note that in general as $BT$ gets higher the spectral occupancy of the waveform relative to the sampling rate increases. This means that at lower $BT$ values, the amount of oversampling needed decreases to meet a certain waveform quality requirement.

$\endgroup$
6
  • $\begingroup$ what does mean " allowing for simplification of subsequent filtering such as the analog reconstruction filter after the D/A converter."? How does it make the filtering simple? $\endgroup$
    – FrimHart64
    Commented Jun 9, 2022 at 13:32
  • $\begingroup$ "in the plot in proximity to f=−0.5 and f=0.5 include the aliasing ", how did you detemine it ? What part of the spectrum ( f = +/-0.5) does give you such information? ( as I know , we should see an overlapping frequency components in case of aliasing, right?) $\endgroup$
    – FrimHart64
    Commented Jun 9, 2022 at 13:39
  • $\begingroup$ "at lower BT values, the amount of oversampling needed decreases to meet a certain waveform quality requirement" mmm in one of my last posts you wrote,, for BT=0.5, oversampling ratio =4 is sufficient, now for BT = 0.25, you used 8... or I dont understand something, do I? $\endgroup$
    – FrimHart64
    Commented Jun 9, 2022 at 13:45
  • $\begingroup$ @FrimHart64 I only used 8 to show the further out spectrum (I could have used 100). It doesn't mean it was necessary. As I explained here, you could use 2. What you use depends on how you do the rest of your design (subsequent filtering), and what your waveform quality requirement is. The duration of the pulse has a much bigger effect on waveform quality than the number of samples per symbol as we see in the plot here showing the sideband level going down significantly as we vary the pulse duration (even within my new big red bar areas associated with the spectrum for 2 samples per symbol) $\endgroup$ Commented Jun 9, 2022 at 14:10
  • 2
    $\begingroup$ @FrimHart64 please post separate questions individually, ongoing discussions in the comments are discouraged $\endgroup$ Commented Jun 10, 2022 at 15:46

Your Answer

By clicking “Post Your Answer”, you agree to our terms of service and acknowledge you have read our privacy policy.

Not the answer you're looking for? Browse other questions tagged or ask your own question.