0
$\begingroup$

I want to understand how to interpret ADEV plots. I was of the understanding that if we see a peak at 1sec of TDEV plot there is a 1Hz noise in Time Interval Error(TIE) Capture.

To understand the relationship between TIE and TDEV I considered TIE to be a sinusoidal wave of 1Hz sampled using a signal of 20Hz (much greater than Nyquist requirement) and for a period of 10sec (tmax)

Sharing the code used:

import numpy as np
import allantools
from matplotlib import pyplot as plt
# import ipywidgets as widgets
from ipywidgets import interact, fixed

np.seterr(divide='ignore', invalid='ignore')


# data generation
# signal characteristics and sampling characteristics
freq = 1

tmin = 0
tmax = 10
sampling_period = 1/16


def generate_data(freq, tmin, tmax, sampling_period):
    t = np.arange(tmin,tmax,sampling_period)
    data = np.sin(2*np.pi*t*freq)
    #data = 
    return data,t
    
def plot_data(ax, t, data):
    ax.plot(t,data)

def compute_adev(data, rate):
    # Load data
    a = allantools.Dataset(data=data,rate=rate,data_type="phase")
    # compute mdev
    a.compute('adev')

    # Plot it using the Plot class
    b = allantools.Plot()
    b.plot(a, errorbars=True, grid=True)
    # You can override defaults before "show" if needed
    b.ax.set_xlabel("Tau (s)")
    b.show()

def call_func(freq=1, tmin=0.0, tmax=10.0, sampling_period=1/20):
    data,t = generate_data(freq, tmin, tmax, sampling_period)
    ax=plt.axes()
    plot_data(ax,t,data)
    compute_adev(data, 1/sampling_period)
    call_func(1, 0.0, 10.0, 1/20)

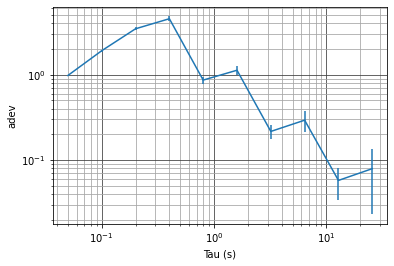
The below Tdev Plot is using tmax=10.0
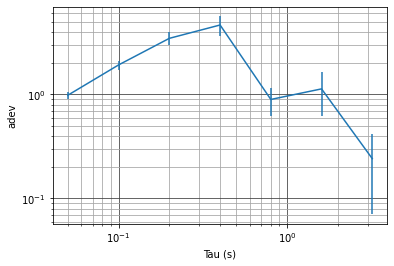
enter image description here The below Tdev Plot is using tmax=100.0

https://i.sstatic.net/6BGEn.png

Question:

The plot is not having peak at 1Hz. Since the input TIE is periodic over 1Hz, shouldn't we expect a peak at Tau = 1sec ?

PS. since i need 300points to create a tag, tagging time-freq and time-domain

$\endgroup$
2
  • $\begingroup$ It looks like you are plotting ADEV, not TDEV-- did you mean ADEV in your question? $\endgroup$ Commented Mar 17, 2022 at 11:22
  • 1
    $\begingroup$ changed to ADEV thanks for pointing $\endgroup$
    – arun
    Commented Mar 17, 2022 at 11:31

1 Answer 1

1
$\begingroup$

I explain the interpretation of ADEV plots in more detail at these posts.

How to interpret Allan Deviation plot for gyroscope?

Allan Variance vs Autocorrelation - Advantages

Is Allan variance still relevant?

Specific to the final question by the OP: The Allan Deviation will have a dip at the inverse of the period of an oscillation, not a peak. The peak occurs at approximately half the period (which is intuitive when you consider Allan Deviation is computed by a subtraction of averaged blocks).

Increase the number of samples in the computation, and you will see the tell tale ADEV of a sinusoidal modulation, which is given by an aliased Sinc function multiplied with a comb response as given by the difference of the (moving for overlap-ADEV or block otherwise) averaging (the Allan Deviation is the standard deviation of the frequency vs time after such processing), as I show in the plot below.

The plot below is for a sinusoidal frequency error at a rate of $f_m = 1$ Hz with a peak fractional frequency deviation of 1. I prefer "Overlap ADEV" since it converges to the same result with less error for a given number of samples. Note the first dip occurs at $\tau=1$ corresponding to the frequency $1/\tau= 1$ Hz. The peak occurs at approximately $\tau = 0.38/f_m$.

ADEV Plot

python code used:

import allantools
import numpy as np
nsamps = 2**16
fs = 1000
freq = 1

t = np.arange(2**16)/fs
signal = np.cos(2*np.pi *freq *t)

a = allantools.Dataset(data=signal,
                       rate=fs,
                       data_type="freq", 
                       taus = np.logspace(-3, 1,1000))

a.compute('oadev')
b = allantools.Plot()
b.plot(a, errorbars=True, grid=True)
b.ax.axis([1e-3, 10, 1e-6, 1])    
b.ax.set_xlabel("Tau (s)")
b.show()
$\endgroup$

Your Answer

By clicking “Post Your Answer”, you agree to our terms of service and acknowledge you have read our privacy policy.

Not the answer you're looking for? Browse other questions tagged or ask your own question.