lets say I am measuring ($z$) Gaussian noise with known variance sigma in each step, i.e. $z_k = v_k$, where $v_k$ is Gaussian distribution with known variance $\sigma_k$ (changing with each step) and not known $\mu_k$. I would like to test a hypothesis that the means are constant: $\mu_k = C$. Is that possible? I don't know where to look. Thank you.
-
$\begingroup$ Do you have access to the actual signal? It's easy enough to just calculate the mean for each step. $\endgroup$– HilmarCommented Jan 12 at 16:35
-
$\begingroup$ Are your $\sigma_k$ constant, or do you have bounds on $\sigma$ for all possible values of $k$? Please edit your question with this information. $\endgroup$– TimWescottCommented Jan 13 at 3:39
1 Answer
The Allan Deviation is a convenient statistical tool for determining if the mean of independent noise samples is constant, or more specifically what is the longest duration in time that we can simplify the statistics of the process to be a constant mean. In reality a constant mean over a long time duration is very difficult to achieve (I'm tempted to say can never exist, but learned to never say never!), noise processes will ultimately be non-stationary, and this appears as "1/f noise", drift, random walk etc...
With the Allan Deviation as "ADEV" (and it's square the Allan Variance), we can see on a convenient plot the time duration in which the standard deviation would go down as the square root of the duration when the process is averaged (as we do when determining the mean). If this occurs, the process is dominated by random white noise. Eventually the ADEV will hit the "flicker floor" and averaging beyond this time the standard deviation won't improve and then will start to get worst, indicating drift and a non-constant mean as a dominant source of the result.
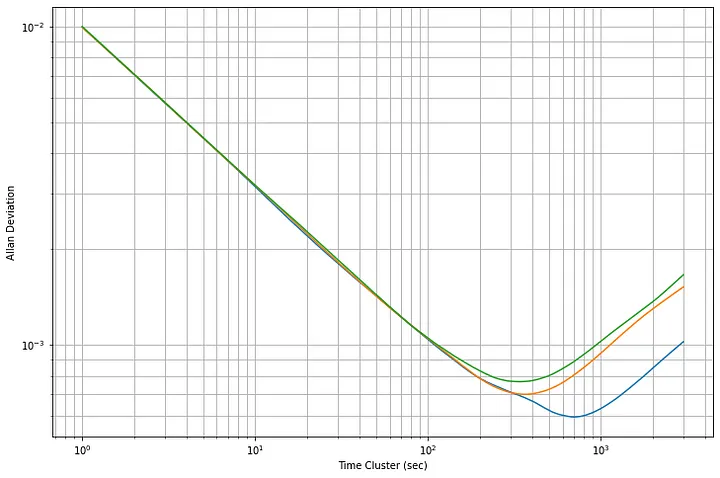
I copied the plot below from this article I quickly Googled but didn't yet read in detail, from the surface it looks like a nice overview of the Allan Variance and it's use. I use the plot to illustrate my point above.
Here we see the curve of ADEV going down 1 decade for every decade of time along the horizontal axis; this is a $1/\sqrt{\tau}$, where $\tau$ is the units of time along the horizontal axis, out to about 300 to 600 seconds. This means out to this time duration, the underlying process (be it a frequency of a clock source, the positional information from a gyroscope, which are two very common uses for ADEV, or any other random variable) can assumed to be a constant mean white noise process. What more accurately models the noise process however is the sum of multiple noise sources, for the smaller time durations (small data captures) the white noise process is dominating, but there are also other noise processes such as a random walk noise process that goes UP as $\sqrt{\tau}$ as we continue to average, as we see on the right side of the ADEV plot above as it becomes the more dominant noise source.
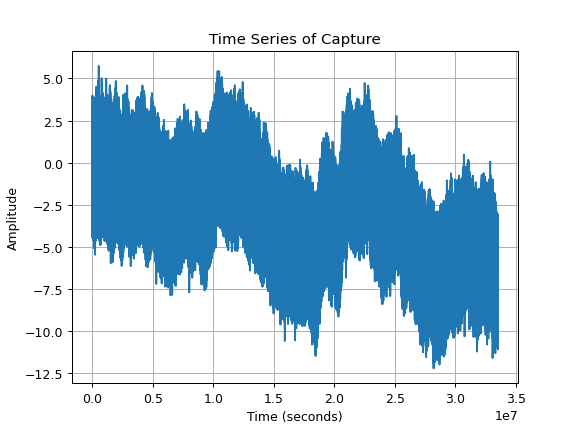
Below is a plot of samples from an example noise process that extends out to nearly 35 million seconds (405 days! Note the 1e7 in the lower right hand corner of the plot). Certainly over that time duration we see that the process does not have a constant mean.
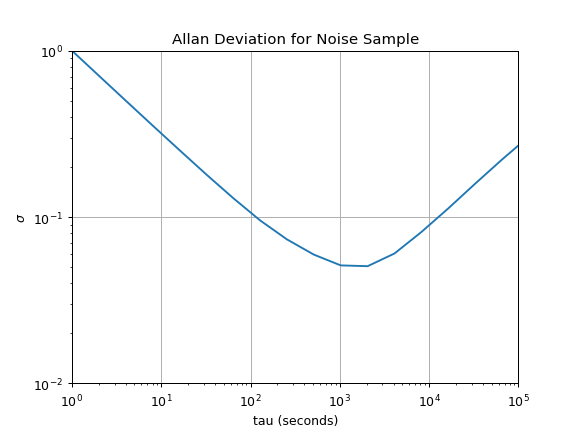
The ADEV for this noise process is plotted below. What this tells us, that if we were to capture only 1000 seconds of this process- and that is all we ever needed to do whatever we are doing with that data, we can treat that capture as a constant mean process. Without any other information, the samples behave identical to that from a constant mean white noise random process.
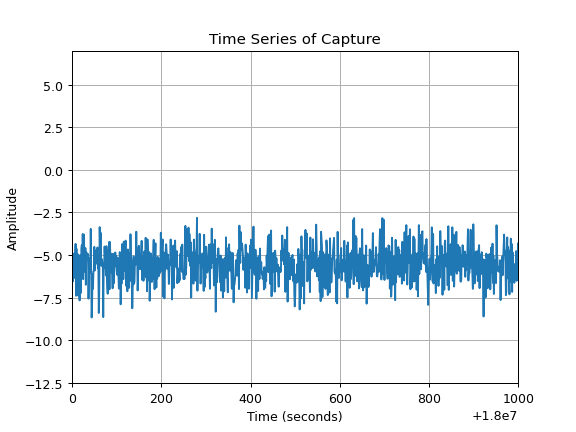
Below shows a zoom in of the same plot above for 1000 samples at an offset of 1.8e7 seconds (offset chosen arbitrarily):
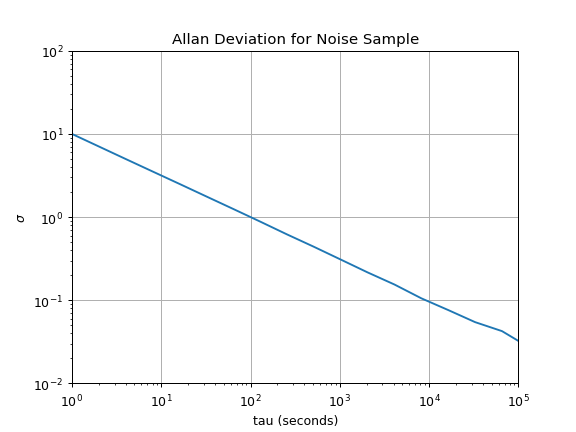
This approach will work for the OP's case of a changing variance per sample if the variance itself is randomly given and independent for each sample, but will not for cases of deterministic changes in the variance, such as if the variance was increasing over time (since the Allan Variance is telling us what the equivalent variance would be over an averaging interval for a constant mean process). Demonstrating this, I created a test waveform of a constant mean random process with randomly chosen variances on every sample (the variances were chosen from a process with a standard deviation of 10) and the mean was set to be constant. The constant mean over the entire duration was confirmed with ADEV regardless of the changing variance per sample:
Other StackExchange Posts on ADEV if there is further interest:
Allan deviation to determine averaging time

