0
$\begingroup$

I am trying to convert a signal into frequency domain using fft then construct a time domain signal (with any length) from the frequency response. With my matlab code, it works fine when there is no noise but there is a weird behaviour when noise is introduced in to the signal.

So let's first look at the case when there is no noise.

clear
Fs = 100;          % Frequency (Hz)
dt = 1/Fs;         % Sampling Time (s)
Tsim_original = 3; % 3 seconds of original data
t = (0:dt:Tsim_original-dt)';     % Time array
signal = sin(2*pi*2*t) + 2 * sin(2*pi*3*t);    % Original signal

% Compute FFT - I'm using Matlab's example on their FFT page
Y = fft(signal);
L = length(signal);
P2 = abs(Y/L);
P1 = P2(1:floor(L/2)+1);
P1(2:end-1) = 2*P1(2:end-1);
f = (Fs*(0:(L/2))/L)';

figure(1)
clf
stem(f, P1, 'Marker', 'none')
hold on
grid on
xlabel('Frequency (Hz)')
ylabel('|P1(f)|')


Tsim = 10;    % Time of constructed signal - I'm using longer time here, will be important later
signal2 = zeros(ceil(Tsim/dt), 1);          % Predefine constructed signal array
t2 = linspace(0, Tsim, length(signal2))';   % Time array

% Construct signal from FFT
% Loop through all the frequencies and add them to gether
for kk = 1 : length(f)
    if f(kk) > 0   % Ignore 0 Hz 
        temp = P1(kk) * sin(2*pi*f(kk)*t2);
        signal2 = signal2 + temp;
    end
end

figure(2)
clf
plot(t, signal)
hold on
grid on
plot(t2, signal2, '--')
legend('Original Signal', 'Constructed Signal')
xlabel('Time (s)')

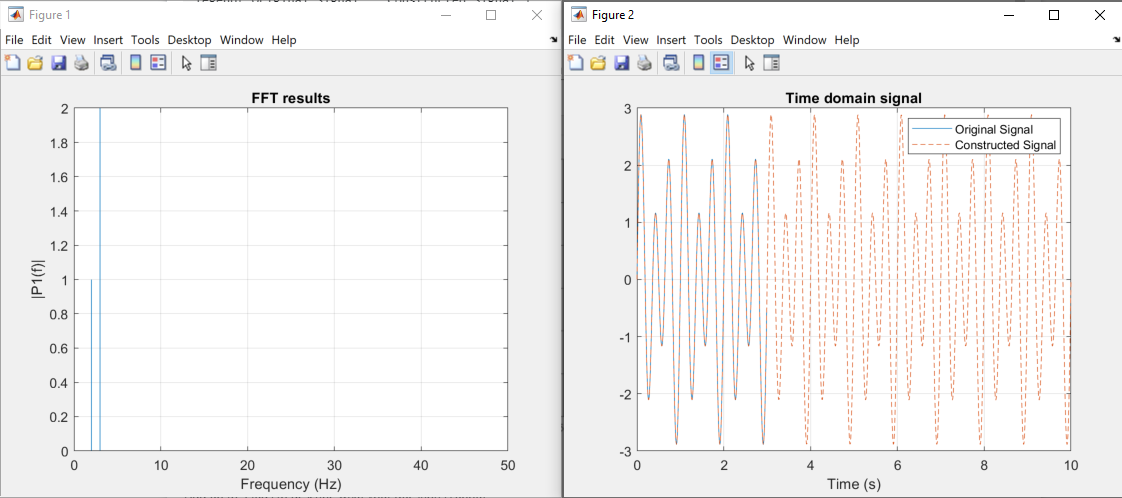
So this works fine and the constructed signal pretty much looks identical to the original signal. The FFT also looks good, with correct frequency and amplitude.

enter image description here

Here's where the problem is. If I add some noise into the signal

signal = sin(2*pi*2*t) + 2 * sin(2*pi*3*t) + randn(length(t), 1);    % Original signal

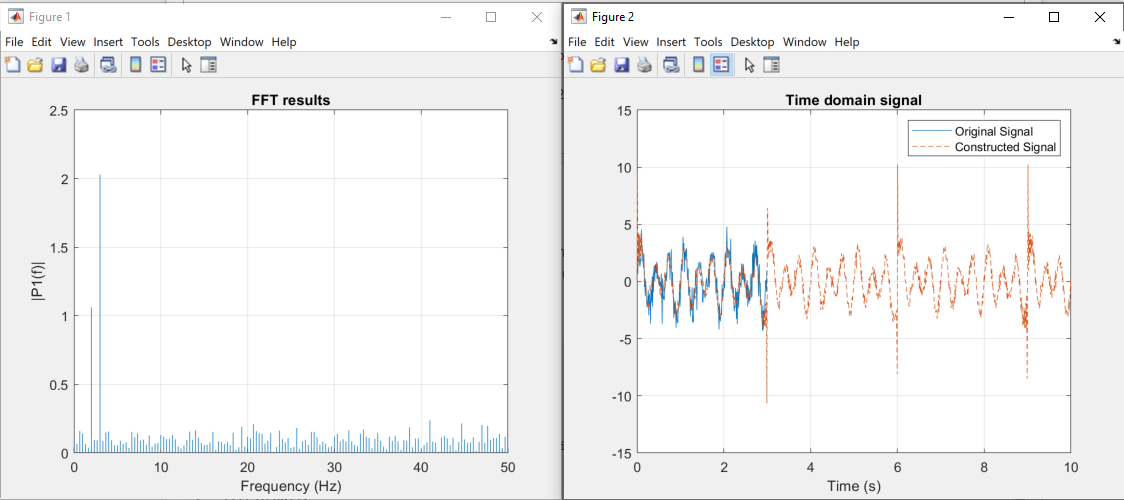
The resulting signal has weird peaks happening every 3 seconds (and at the start), which is equivalent to the length of the original signal. If I change the length of the original signal to a different number, the frequency of the peaks also change accordingly. For example, if I change the the original signal to be 5 seconds long, the constructed signal has a peak every 5 seconds also.

I need the constructed signal to look like the figure below but without the peaks every X seconds. Note that I do not want to filter the noise, but rather I want to keep the noise.

So my questions are:

  • What is the cause of these peaks? Am I doing something wrong?
  • Is there a better way to reconstruct the time domain signal (with any length)?
  • I understand matlab has the ifft function available already, but I am not sure how to get it to work with the absolute power P1 of the frequency response. I kind of have to keep this FFT format as it's already in other parts of the code.

enter image description here

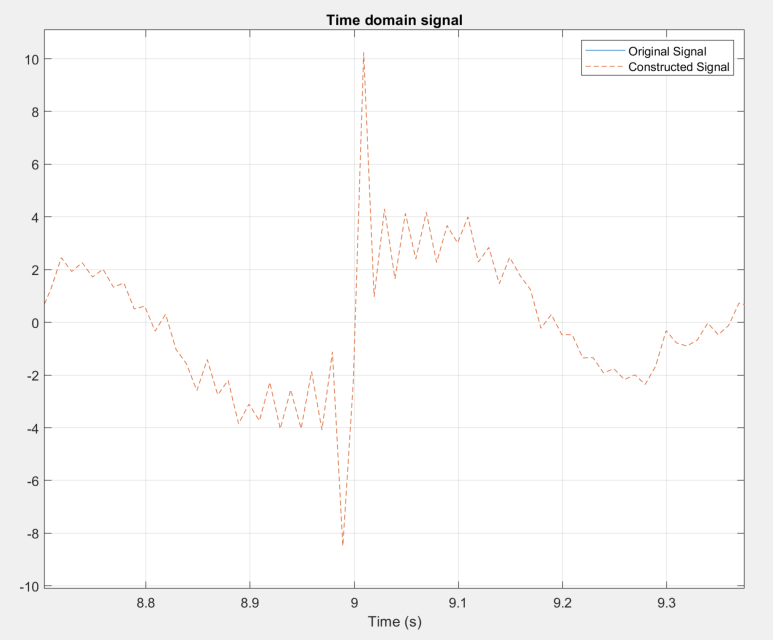
When zoomed in, the peak looks like this enter image description here
Thank you so much for your help!!

$\endgroup$

2 Answers 2

2
$\begingroup$

Lot's of things are questionable here

  1. You are discarding the phase of the Discrete Fourier Transform (DFT)
  2. You don't do a complete inverse DFT, but instead just do a weighted sum of sine waves. That's equivalent of hard-wring the phase of the DFT to 90 degrees.
  3. Extending by using a longer inverse DFT is equivalent to doing a periodic extension. Doing a long inverse DFT is very inefficient.
  4. Your inverse FFT sample rate is slightly off due to incorrect use of linspace(). The check the spacing of your time axis.

The peak is due to you discarding the phase. The spectrum of Noise from randn() is mostly white, i.e. same magnitude at all frequencies but it has a random phase. By making all the phases the same, you create basically the DFT of a unit impulse which creates a peak in the inverse DFT

$\endgroup$
2
  • $\begingroup$ Could you please suggest what I can do to fix this? I have tried adding random phase shift to all the frequencies, but I still get the same peaks anyway unfortunately. $\endgroup$
    – pakornpp
    Commented Mar 16, 2022 at 7:53
  • 2
    $\begingroup$ Just use the original phase and do a complete inverse DFT. That reconstructs the original signal $\endgroup$
    – Hilmar
    Commented Mar 16, 2022 at 7:59
1
$\begingroup$

I believe that in the beginning, you are trying to reconstruct a «sine only signal» from FFT magnitude and a sine only set of basis functions - with success.

Later on, when you add noise, you have a component that cannot be described by only sines, you need a set of cosines (or the complex exponensial) to describe that signal. Thus your method fails.

Fitting sines to the DFT in order to extrapolate a periodic signal is interesting, but it is limited to perfectly periodic signals and a DFT of exactly that period (or a multiple thereof). If you can accept such restrictions, it seems easier to just «copy and paste» the time domain snippet repeatedly, as in various PSOLA-esque methods?

$\endgroup$
2
  • $\begingroup$ That's pretty much what I have been doing. Manually chopping off the parts where I don't want then copy/paste the part I want. However, I prefer to not do this as I will get more data with different size and sampling rate in the future. $\endgroup$
    – pakornpp
    Commented Mar 16, 2022 at 7:55
  • 1
    $\begingroup$ If you are manually identifying the periodicity today, you will have to do the same job with an FFT based solution. Unless you develop a method to identify periodicity automatically, but then you could use that method for time domain extrapolation too? $\endgroup$
    – Knut Inge
    Commented Mar 16, 2022 at 8:34

Your Answer

By clicking “Post Your Answer”, you agree to our terms of service and acknowledge you have read our privacy policy.

Not the answer you're looking for? Browse other questions tagged or ask your own question.