I am trying to convert a signal into frequency domain using fft then construct a time domain signal (with any length) from the frequency response. With my matlab code, it works fine when there is no noise but there is a weird behaviour when noise is introduced in to the signal.
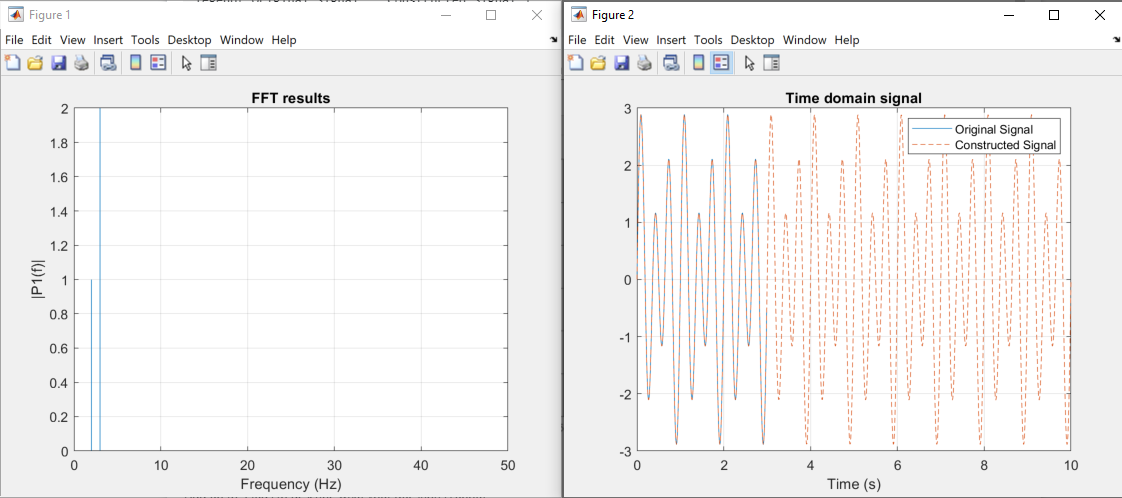
So let's first look at the case when there is no noise.
clear
Fs = 100;          % Frequency (Hz)
dt = 1/Fs;         % Sampling Time (s)
Tsim_original = 3; % 3 seconds of original data
t = (0:dt:Tsim_original-dt)';     % Time array
signal = sin(2*pi*2*t) + 2 * sin(2*pi*3*t);    % Original signal

% Compute FFT - I'm using Matlab's example on their FFT page
Y = fft(signal);
L = length(signal);
P2 = abs(Y/L);
P1 = P2(1:floor(L/2)+1);
P1(2:end-1) = 2*P1(2:end-1);
f = (Fs*(0:(L/2))/L)';

figure(1)
clf
stem(f, P1, 'Marker', 'none')
hold on
grid on
xlabel('Frequency (Hz)')
ylabel('|P1(f)|')


Tsim = 10;    % Time of constructed signal - I'm using longer time here, will be important later
signal2 = zeros(ceil(Tsim/dt), 1);          % Predefine constructed signal array
t2 = linspace(0, Tsim, length(signal2))';   % Time array

% Construct signal from FFT
% Loop through all the frequencies and add them to gether
for kk = 1 : length(f)
    if f(kk) > 0   % Ignore 0 Hz
        temp = P1(kk) * sin(2*pi*f(kk)*t2);
        signal2 = signal2 + temp;
    end
end

figure(2)
clf
plot(t, signal)
hold on
grid on
plot(t2, signal2, '--')
legend('Original Signal', 'Constructed Signal')
xlabel('Time (s)')
So this works fine and the constructed signal pretty much looks identical to the original signal. The FFT also looks good, with correct frequency and amplitude.

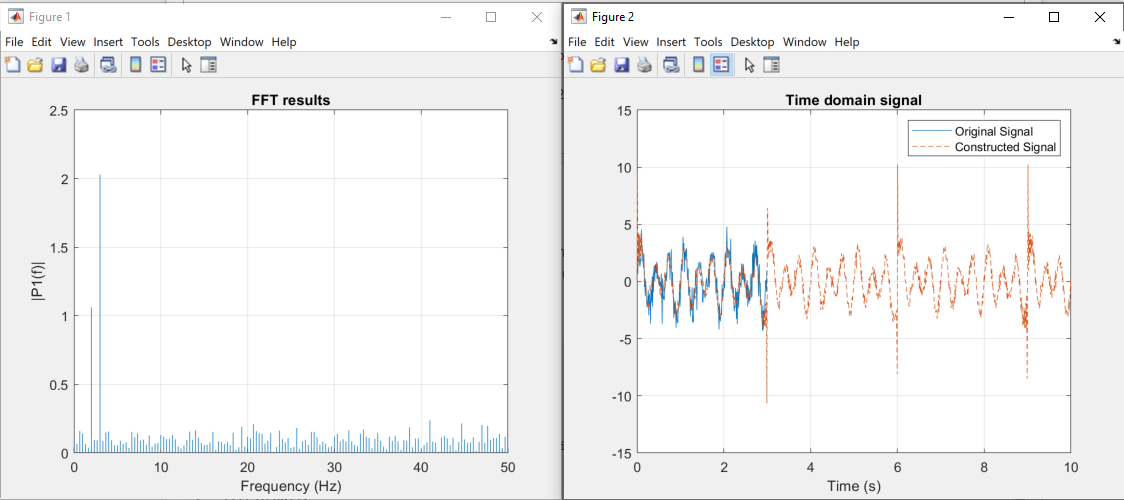
Here's where the problem is. If I add some noise into the signal
signal = sin(2*pi*2*t) + 2 * sin(2*pi*3*t) + randn(length(t), 1); % Original signal
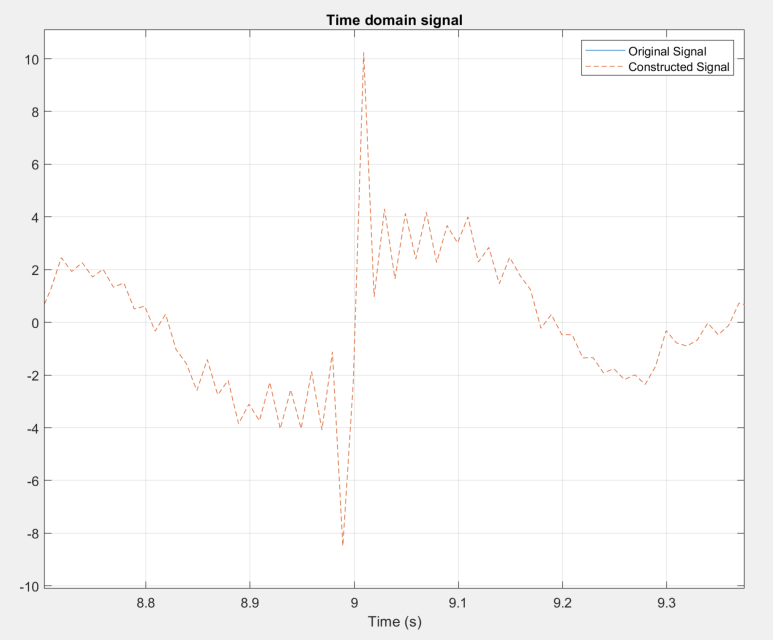
The resulting signal has weird peaks happening every 3 seconds (and at the start), which is equivalent to the length of the original signal. If I change the length of the original signal to a different number, the frequency of the peaks also change accordingly. For example, if I change the the original signal to be 5 seconds long, the constructed signal has a peak every 5 seconds also.
I need the constructed signal to look like the figure below but without the peaks every X seconds. So my questions are:
- What is the cause of these peaks? Am I doing something wrong?
- Is there a better way to reconstruct the time domain signal (with any length)?
- I understand matlab has the
ifft function available already, but I am not sure how to get it to work with the absolute power P1 of the frequency response. I kind of have to keep this FFT format as it's already in other parts of the code.

Thank you so much for your help!!
