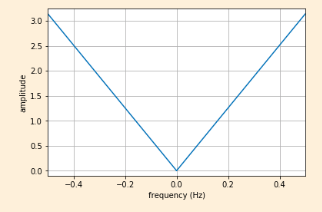
I have one question related to finding amplitude spectrum (transfer function) of signal knowing that output signal is time derivative of input signal. I have the answer graph but I don't understand the reason.

2 Answers
HINT:
If $X(j\omega)$ is the Fourier transform of a signal $x(t)$, try to remember (or look up) how $X(j\omega)$ is related to the Fourier transform of the derivative $x'(t)$.
Some people are more familiar with this in the Laplace transform domain: the time derivative corresponds to which operation in the Laplace transform domain? Replace $s$ with $j\omega$, and you'll understand the given figure.
-
$\begingroup$ Yep! I got it, thank you very much! $\endgroup$ Commented Mar 14, 2021 at 15:50
Based on what you explained, the output signal $y(t)$ is given by: $$ y(t) = \frac{dx(t)}{dt} $$ where x(t) is the input signal.
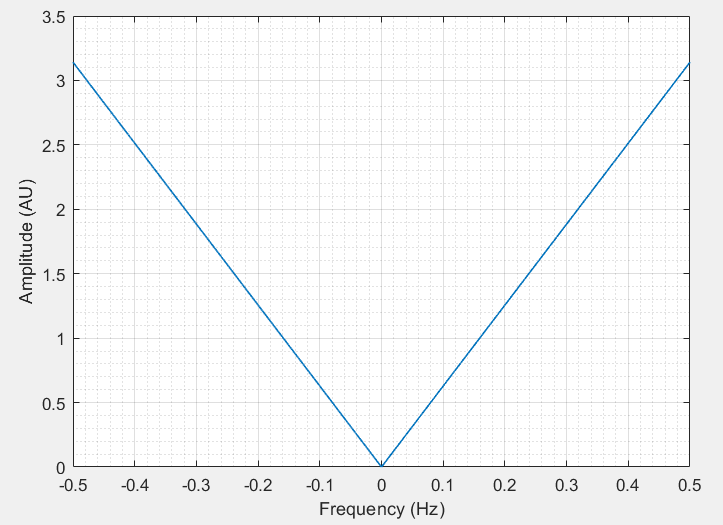
By transforming this problem in the Laplace domain, we can re-express the above equation as: $$ Y(s) = sX(s) - x(0^{-}) $$ If we know that $x(0^{-})=0$, then this can be simplified as $Y(s) = sX(s)$. Using this expression we can now obtain the transfer function of our system in the Laplace domain $H(s)$ as: $$ H(s) = \frac{Y(s)}{X(s)} = s $$ In the Fourier domain, we can replace $s=j\omega$, such that: $$ H(j\omega) = \frac{Y(j\omega)}{X(j\omega)} = j\omega $$ Then we can find the amplitude of $H(j\omega)$, which is equal to: $$ |H(j\omega)| = |j\omega| = |\omega| $$ You can also express this in terms of linear frequency $f$ (in terms of Hz), where the angular frequency $\omega$ is related to linear frequency by $\omega = 2\pi f$. This gives us: $$ |H(f)| = 2\pi |f| $$
If you simulate this, you will get the following plot, which is the same as the one you posted.

