I am trying to understand how wavelet transform can be used to denoise a time series or signal and how to plot the scalogram image. My signal has a lot of fluctuations and as such I am finding it difficult to denoise. Morevoer, to plot the scalogram I need to know the frequency. I don't know what is the frequency for this particular kind of time series obtained from a dynamical system of the form: Logistic Map given by: $$x[n] = 4\big(x[n-1]\big)\big(1-x[n-1]\big)$$ Systems similar to this type of dynamical systems are the Lorenz, Mackey-Glass. Can somebody please help:
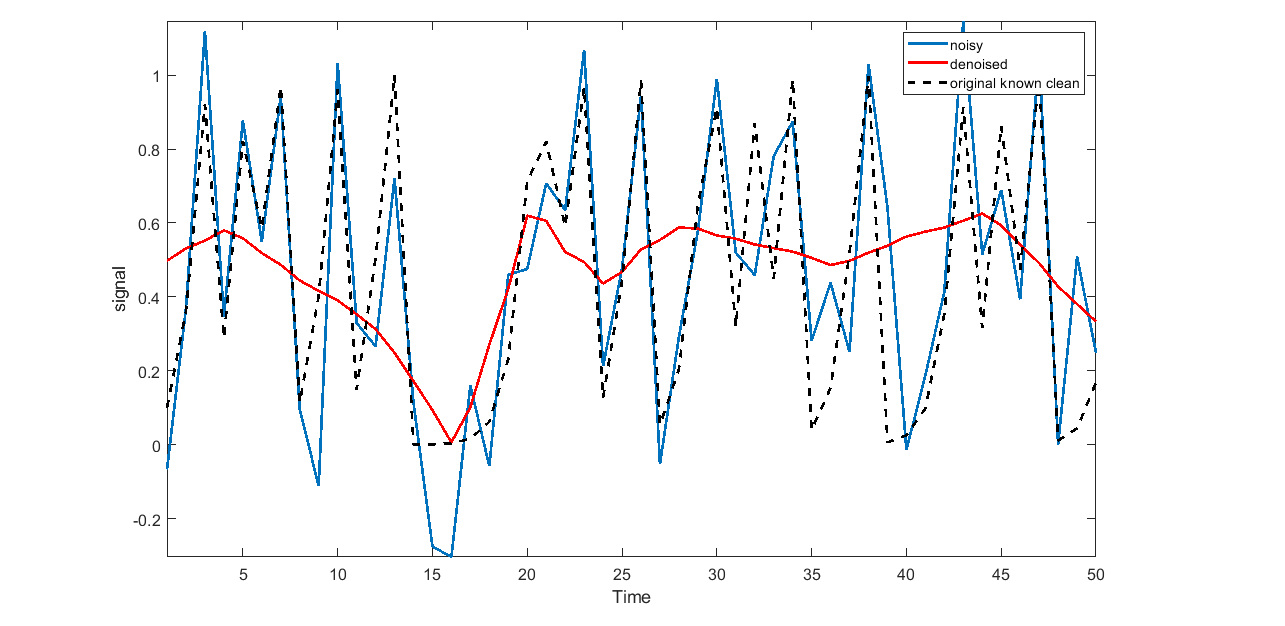
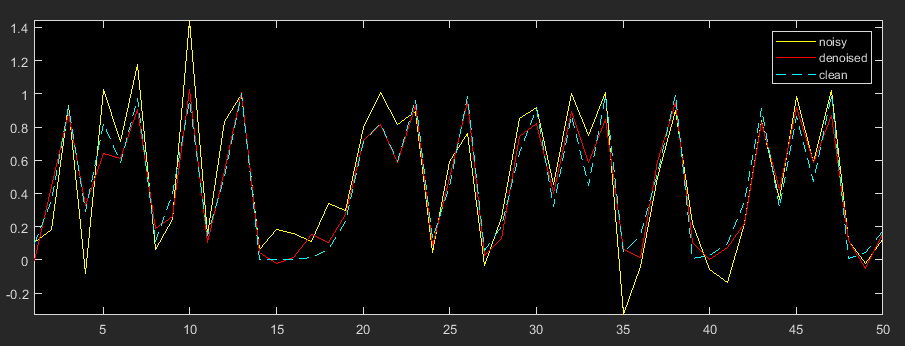
How to properly denoise the signal? As observed, from the plot the denoised signal
denoiseddoes not look exactly the same as the clean signalx(black dotted line), so what are other parameters or wavelet types that I could use and how to decide which ones to use. Is there a rule of thumb?What is the sampling and nyquist frequency for this kind of signal and
how to plot the scalogram image: I used
wt()to obtain the wavelet coefficients. After that how to plot the image of scalogram so that X axis is time and Y axis is Frequency?x(1) = 0.1; % initial condition (can be anything from 0 to 1) M = 50; %number of data points (length of the time series) for n = 2:M, % iterate x(n) = 4*x(n-1)*(1-x(n-1)); end %add noise x_noise = awgn(x,10,'measured'); %denoise using wavelet denoised = wdenoise(x_noise, 3,'Wavelet','db3',... 'DenoisingMethod','Bayes',... 'ThresholdRule','Median',... 'NoiseEstimate','LevelIndependent'); figure plot(x_noise) axis tight hold on plot(denoised,'r') fb = cwtfilterbank('SignalLength',M); [cfs,frq] = wt(fb,denoised);


