I am working on filtering of data using the Moving average filter in MATLAB.
My data is recorded temperature values on the Y-axis and Time(in seconds) on the X-axis
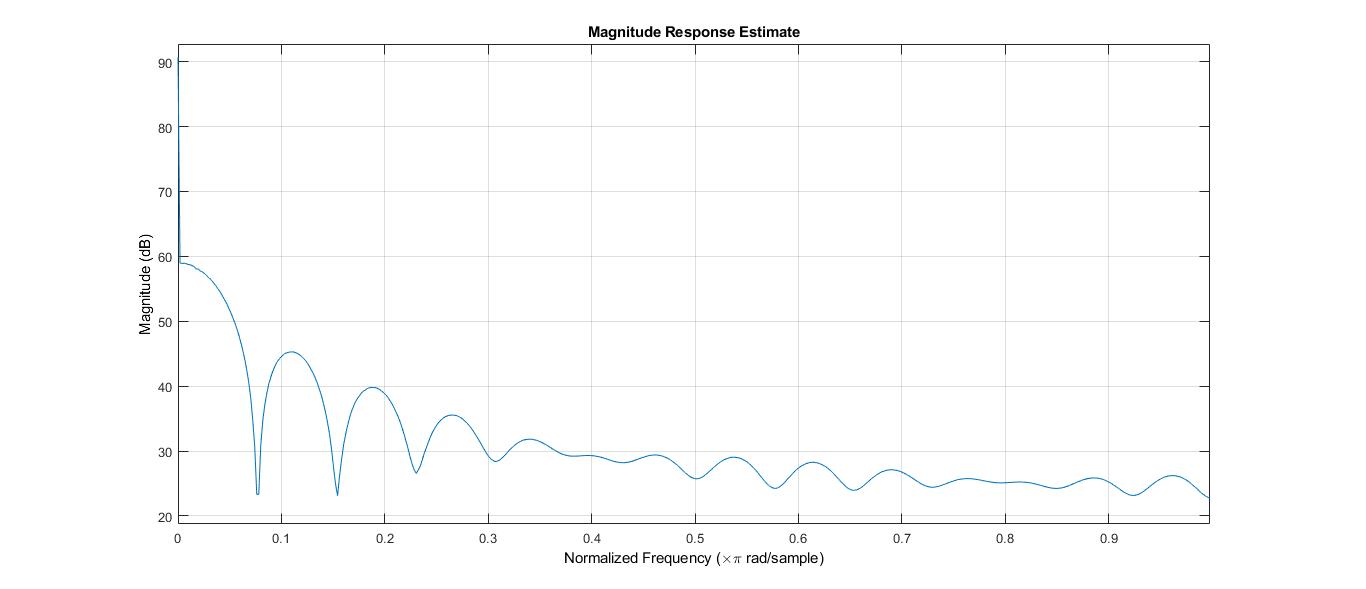
(I'm getting the magnitude response curve of the Moving average filter as attached)
The shape of the curve seems fair for the moving average filter, according to the theory but,
I want to ask, why am I getting all the magnitude value for MA filter positive? (is this correct?)
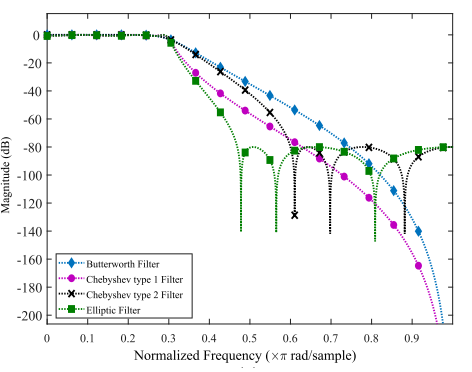
Implementing other filters like Butterworth etc. on the same data gives the magnitude values to be negative (image attached)
Here is my MATLAB Code for MA (if it helps)
%T.Temp is table column containing Temperature values in double format.

MovAvg = dsp.MovingAverage(5)

movAvgOut = MovAvg(T.Temp)

fvtool(movAvgOut)

%Gives output the first image I attached
Any help is appreciated. Thank you.
Ps - DSP is not my field. This work is part of a bigger project i'm involved in, and need some help. Please bear with me if I sound irrational.


fvtoolfor visualizing spectrum of your data, not the actual filter. If you want to visualize things the way you want, usefftroutine, scale the output with 0 dB being a particular value that you want and plot it. Values of temperature are much higher than 1, so it's normal you get levels higher than 0 dB. (Not sure what would be the meaning of 0 dB for temperature anyway...). Alternatively do this trick. Infvtoolclick Analysis, Analysis parameters and tick Normalize amplitude to 1 (0 dB). This will normalize the values so that maximum is always 0 d. $\endgroup$