0
$\begingroup$

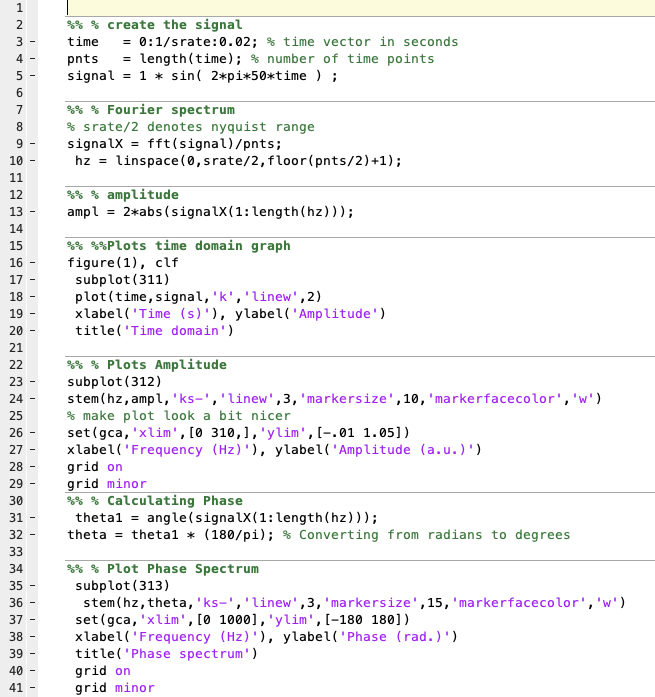
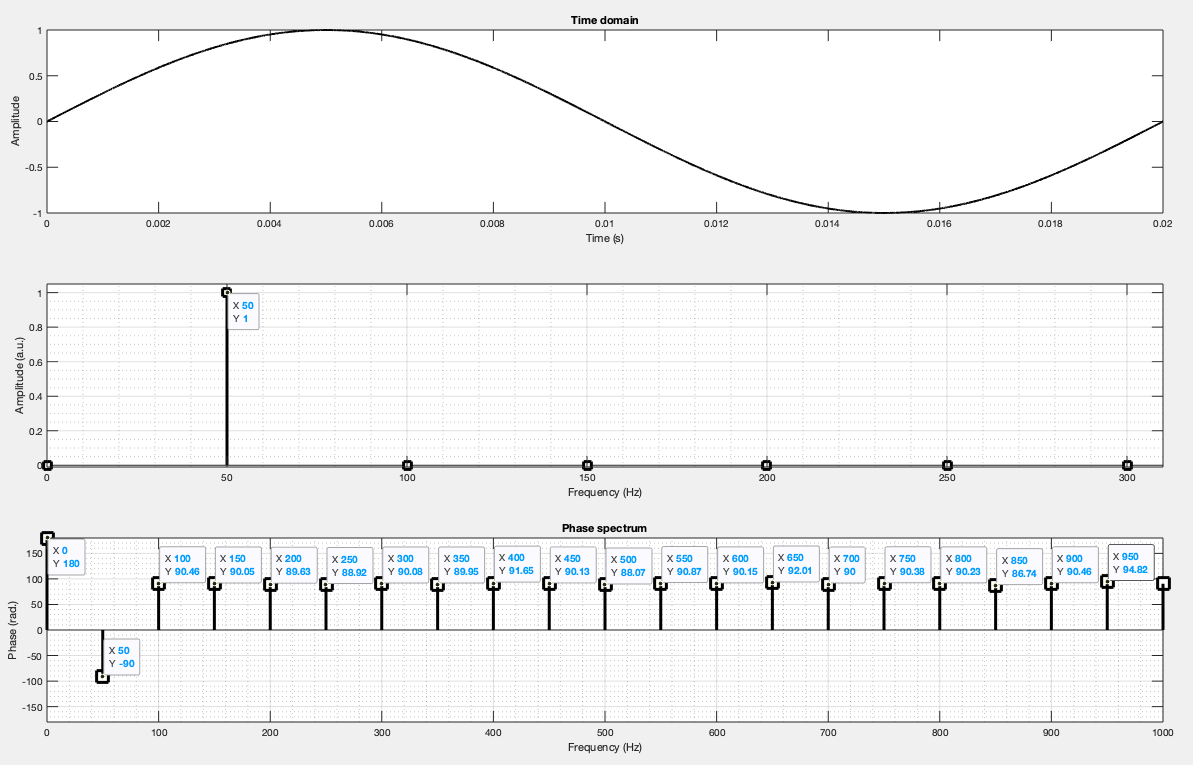
Probably a simple question to answer. I have been trying to use the fft function in MATLAB and have been succesful to get the amplitude spectrum of a known signal. But when working out the phase spectrum I am unsure if its the correct output.

Can anyone explain what the phase spectrum in fft is used for? I have researched other places but have not a satisfactory answer.

If for example I had a pure sine wave what would the phase spectrum show and how will I know if it is correct.

I can give example of my MATLAB code if necessary but if someone can give a basic explanation using MATLAB it will be much appreciated.

enter image description here

enter image description here

$\endgroup$
6
  • $\begingroup$ The half factor is correct. The other half is in the complex conjugate mirror image bin. This is because $$ \cos(\theta) = \frac{e^{i\theta}+e^{-i\theta}}{2}$$ See the 1/2 there? It is also there in (19) from my answer. $\endgroup$ Commented Jul 7, 2020 at 22:37
  • $\begingroup$ Sorry you lost me there where is (19) in your answer. $\endgroup$ Commented Jul 7, 2020 at 22:40
  • $\begingroup$ Who says you did anything wrong. Looking a Matlab code makes me go blind. You are better off in my opinion learning the DFT devoid of a Hz interpretation, it has to do with the sampling rate, not the behavior of the DFT. Print the magnitudes of the bins, don't plot them. Tell me they aren't effectively zero. $\endgroup$ Commented Jul 7, 2020 at 22:41
  • $\begingroup$ The second cited equation. Numbers in parentheses in academic papers are reference numbers of equations. $\endgroup$ Commented Jul 7, 2020 at 22:42
  • $\begingroup$ According to explanation by Nathan there should be essentially 0 phase angle because this being a pure sinewave with no phase shift. The idea of this being an issue with sampling rate makes sense but I'm confused now. Explanation by Nathan suggested my phase spectrum might be wrong $\endgroup$ Commented Jul 7, 2020 at 22:43

3 Answers 3

1
$\begingroup$

I think that the plot you display does not show the correct answer, what makes me think that is that you inject in your fft a pure sinewave with an initial phase equal to 0. Therefore your plot should display a 0 phase shift for every frequency bins.

For exemple, below you can see the phase plot of a pure sine wave with an initial phase shift of 30 degrees.

enter image description here

The phase spectrum will be here to tell you in which way your signals are delayed for each frequency components.

$\endgroup$
3
  • $\begingroup$ Your explanation makes sense. Thank you for that. $\endgroup$ Commented Jul 7, 2020 at 17:04
  • $\begingroup$ Any advice how I can change my code to get the correct phase spectrum? $\endgroup$ Commented Jul 7, 2020 at 17:05
  • 1
    $\begingroup$ I hope you have read the discussion and realize that your zero phase values on the off bins are by convention. A pure sine wave with whole number frequency in a DFT will have a strictly imaginary bin value pair, while a cosine wave will be strictly real. You seem to have stated the reverse. The rest of the bins will be zero (0+0i), which has no phase except by convention. See "Realizations of the function in common computer languages" in en.wikipedia.org/wiki/Atan2 and stackoverflow.com/questions/47909048/… @MMS1986, you too. $\endgroup$ Commented Jul 9, 2020 at 18:09
0
$\begingroup$

Sorry, I don't use MATLAB.

Your situation is quite explanable. For a single pure tone with a whole number of cycles in the frame, the expecatation is that two bins, a conjugate pair, will be non-zero and the rest of the bins will be zero. The relationship between the signal definition and those bin values using a 1/N normalized DFT is this:

$$ S_n = M cos( f \cdot \frac{ 2\pi }{ N } n + \phi ) \tag 4 $$

(For unnormalized, like Matlab, multiply by $N$)

$$ Z_k = \frac{ M }{ 2 } e^{ i \phi } \, \text{ when } \, k=f \tag {19} $$

Using the terminology in my article:

The conjugate bin at $N-k$ will have the conjugate value, that is, the phase has the opposite sign.

Now, for the rest of the bins, the values you are getting are meaningless and due to numerical imprecision. Technically, they should be zero. In polar coordinates the value at the origin has no phase angle, or it can be any angle if you prefer.

Now, if you have a pure tone that is not a whole number of cycles in the frame, the phase angle for each bin can be found without calculating the DFT itself by using equation (25).

If you have a frequency that is near a whole number of cycles, the relationship between the phase in the signal definition and the phase of the DFT bin is given in my answer here:

FFT Phase interpretation of input signal with non-integer number of cycles in FFT window

$\endgroup$
8
  • $\begingroup$ I know in the definition that MATLAB uses for fft at a given frequency, the value of 𝑋_{𝑘} depends upon the number of samples N that are taken. For this reason in the MATLAB code I divided the fft algorithm by number of time points, which you referred to as "normalising". I have normalised but still the phase spectrum is not as Nathan suggested (which makes sense) $\endgroup$ Commented Jul 7, 2020 at 22:09
  • $\begingroup$ @MMS1986 Normalizing the DFT merely rescales the bin values as DFT is a linear transformation, it does not alter the phase values. If you look at the magnitude of your off-frequency bins you should (with Matlab's index adjustment) find values about 10^(-16) which is the precision limit of double floats. Theoretically, they should be true zero, and thus the phase angle is nominally set at zero, but any value is valid. Numerically, the calculations are going to retain some rounding errors so there will likely be non-zero, but extremely small, meaningless values. $\endgroup$ Commented Jul 7, 2020 at 22:25
  • $\begingroup$ What is the angle of 0+0i? I strongly recommend you read dsprelated.com/showarticle/754.php for an understanding of what $e^{i\theta}$ really means. $\endgroup$ Commented Jul 7, 2020 at 22:29
  • $\begingroup$ I can't seem to find which angle you are referring to? $\endgroup$ Commented Jul 7, 2020 at 22:30
  • $\begingroup$ I'll have a look at the link you sent. $\endgroup$ Commented Jul 7, 2020 at 22:31
0
$\begingroup$

If the phase is real (0 degrees or 180 degrees) then the spectral component is symmetric around the center of the data vector, like an integer periodic cosine wave. If the phase is imaginary, then the spectral component is anti-symmetric, like an integer periodic sine wave. If the complex FFT result contains non-insignificant values in both the real and imaginary components, then the spectral component (or sinusoidal wave) is a mix of symmetric (cosine) and anti-symmetric (sine) components, according to the usual trig identities.

Basically the phase tells you the shape of the waveform, or the shift of a sinusoid within the FFT aperture, with respect to the center of the FFT window.

$\endgroup$
1
  • $\begingroup$ So if I had a signal with two sine waves i.e. in MATLAB I add the two waveform together. One at phase shifted by 30 and the other phase shifted by 90. I would expect in the phase spectrum two "blips" in positive (one at 30 and other at 90) and a further two corresponding to the negative angle? $\endgroup$ Commented Jul 7, 2020 at 22:12

Your Answer

By clicking “Post Your Answer”, you agree to our terms of service and acknowledge you have read our privacy policy.

Not the answer you're looking for? Browse other questions tagged or ask your own question.