0
$\begingroup$

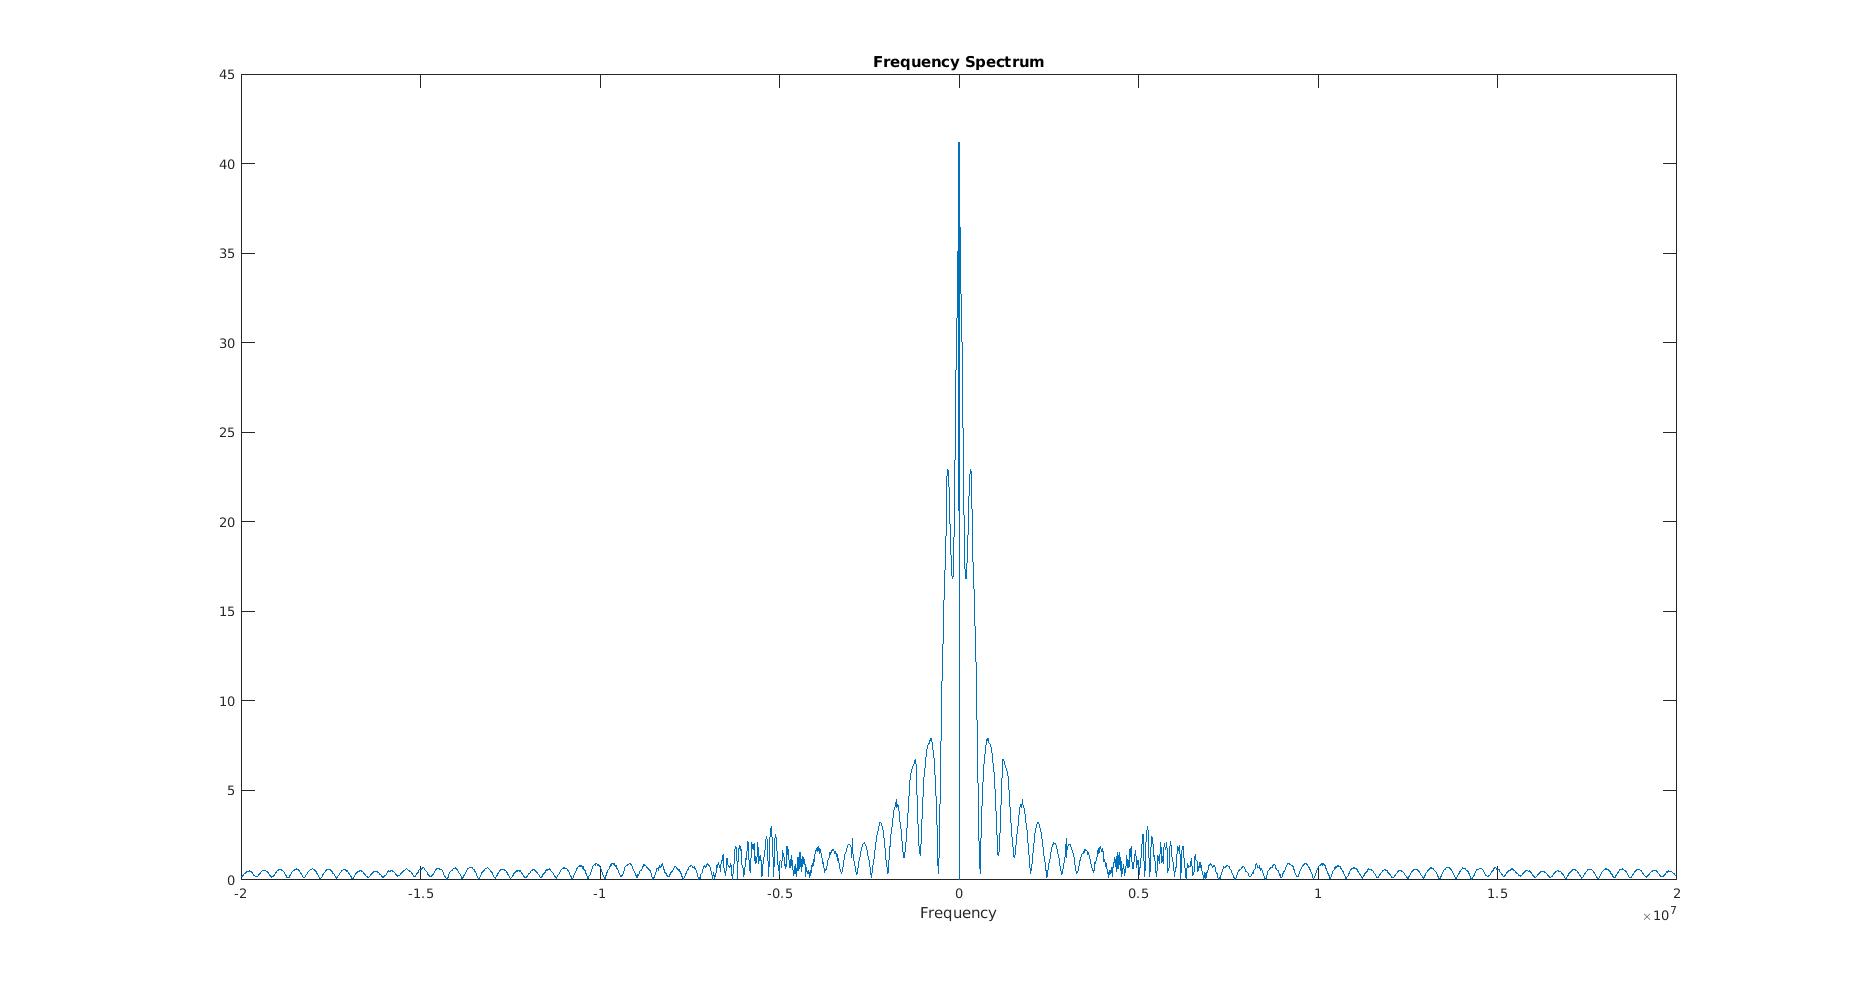
I have a very simple code for ploting frequency spectrum of a signal in MATLAB. My center frequency is at 5e6 but I see a much higher peak at zero frequency despite the fact that I remove DC component from my signal. Why this peak happens?

Fs = 40e6 ; 
[freq,z_freq] = freq_spectrum(RF_ch,Fs) ; 
figure;
plot(freq,abs(z_freq));xlabel('Frequency');title('Frequency Spectrum') 

function [f,z] = freq_spectrum(x,Fs)  
N = size(x,1) ; %size(x) 
f = -Fs/2:Fs/(N-1):Fs/2;
x = detrend(x) ; % or %x = x - mean(x);
z = fftshift(fft(x))./numel(x) ;
end 

enter image description here

$\endgroup$

1 Answer 1

1
$\begingroup$

The OP may have removed DC (the mean of the signal) and that would be clear by zooming in on DC to visibly see the null that does exist there. If the null does not exist, then that would mean the mean signal was not properly removed.

The width (effective bandwidth) of the null if done by a simple subtraction of the mean would be approximately $1/T$ in Hz where $T$ is the duration of the data capture in seconds. This appears to be a very long capture and therefore the null would be very tight.

The plot suggests that there is a lot more low frequency content besides a DC offset. If the expected signal is at 5e6, then a high pass filter with a cutoff at approximately 1e6 would be easy to implement and more effective in this case. Further a log scale plot of the vertical axis will make for a better presentation of the spectrum details.

$\endgroup$

Your Answer

By clicking “Post Your Answer”, you agree to our terms of service and acknowledge you have read our privacy policy.

Not the answer you're looking for? Browse other questions tagged or ask your own question.