I'm trying to learn DSP through using Python's scipy package.
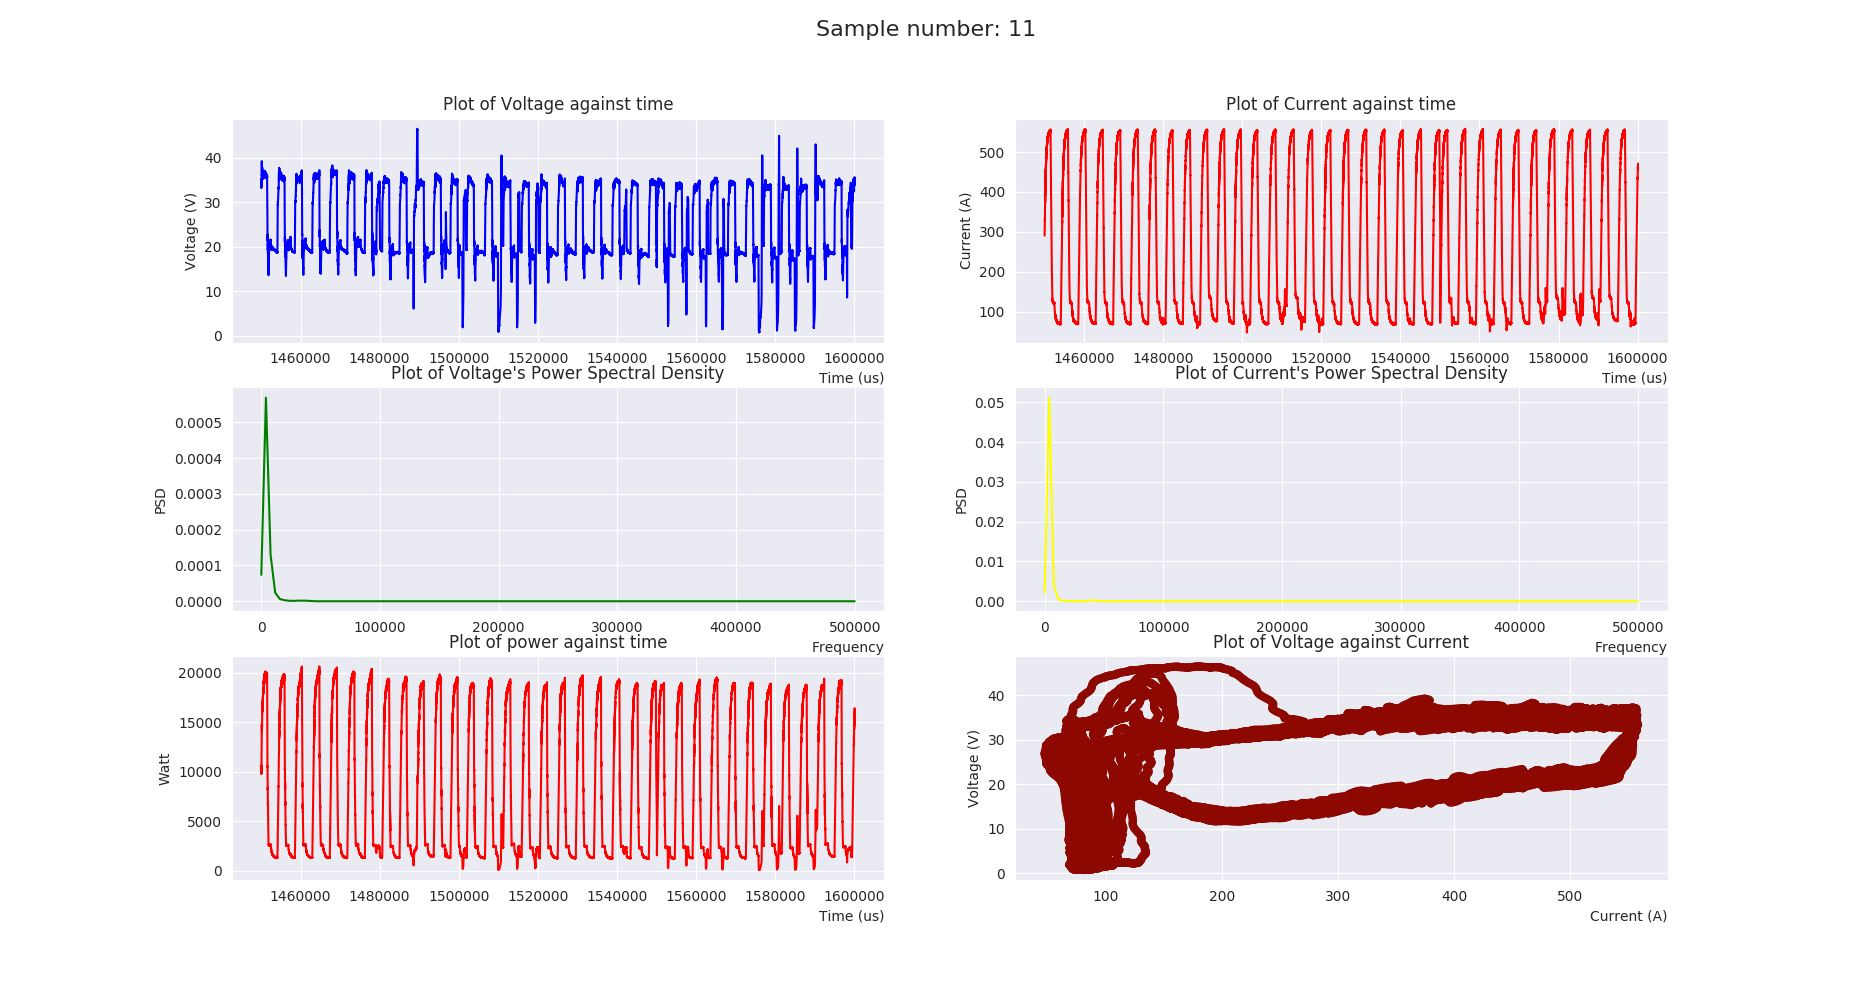
I have measure some 200Hz signal from a machine. Now I want to inspect the spectral density of the signal. Here's the signal plotted out:

As you can see, the signal is obviously not a low frequency signal. However, I still get the PSD graph like below. Here's the code I have been using:
def plot_and_save(sample,i=""):
filepath = sample + "/" + "merged_data.csv"
df = pd.read_csv(filepath)

sns.set_style("darkgrid")
sns.set_colodef plot_and_save(sample,i=""):r_codes("dark")
fig1, axes = plt.subplots(3,2)
fig1.figsize = [1920,1080]

axes[0,0].plot(df["Time"], df["Voltage"], marker="",color="blue")
axes[0,0].set_title("Plot of Voltage against time")
axes[0,0].set_xlabel("Time (us)", ha= "right", x=1.0)
axes[0,0].set_ylabel("Voltage (V)")

axes[0,1].plot(df["Time"], df["Current"], marker="",color="red")
axes[0,1].set_title("Plot of Current against time")
axes[0,1].set_xlabel("Time (us)", ha= "right",x=1.0)
axes[0,1].set_ylabel("Current (A)")

sampling_freq = 1e6
vol_f, vol_psd = welch(df["Voltage"].to_numpy(), fs=sampling_freq)
axes[1,0].plot(vol_f, vol_psd, marker="",color="green")
axes[1,0].set_title("Plot of Voltage's Power Spectral Density")
axes[1,0].set_xlabel("Frequency", ha= "right",x=1.0)
axfilepath = sample + "/" + "merged_data.csv"
df = pd.read_csv(filepath)

sns.set_style("darkgrid")
sns.set_color_codes("dark")
fig1, axes = plt.subplots(3,2)
fig1.figsize = [1920,1080]

axes[0,0].plot(df["Time"], df["Voltage"], marker="",color="blue")
axes[0,0].set_title("Plot of Voltage against time")
axes[0,0].set_xlabel("Time (us)", ha= "right", x=1.0)
axes[0,0].set_ylabel("Voltage (V)")

axes[0,1].plot(df["Time"], df["Current"], marker="",color="red")
axes[0,1].set_title("Plot of Current against time")
axes[0,1].set_xlabel("Time (us)", ha= "right",x=1.0)
axes[0,1].set_ylabel("Current (A)")

sampling_freq = 1e6
vol_f, vol_psd = welch(df["Voltage"].to_numpy(), fs=sampling_freq)
axes[1,0].plot(vol_f, vol_psd, marker="",color="green")
axes[1,0].set_title("Plot of Voltage's Power Spectral Density")
axes[1,0].set_xlabel("Frequency", ha= "right",x=1.0)
axes[1,0].set_ylabel("PSD")

cur_f, cur_psd = welch(df["Current"], fs=sampling_freq)
axes[1,1].plot(cur_f, cur_psd, marker="",color="yellow")
axes[1,1].set_title("Plot of Current's Power Spectral Density")
axes[1,1].set_xlabel("Frequency", ha= "right",x=1.0)
axes[1,1].set_ylabel("PSD")

axes[2,0].plot(df["Time"], df["Current"]*df["Voltage"], marker="",color="red")def plot_and_save(sample,i=""):
axes[2,0].set_title("Plot of power against time")
axes[2,0].set_xlabel("Time (us)", ha= "right",x=1.0)
axes[2,0].set_ylabel("Watt")

sns.scatterplot(x="Current", y="Voltage", data=df, ax=axes[2,1], color = 'r', edgecolor="None", linewidth=0)
axes[2,1].set_title("Plot of Voltage against Current")
axes[2,1].set_xlabel("Current (A)", ha="right", x=1.0)
axes[2,1].set_ylabel("Voltage (V)")

fig1.suptitle("Sample number: " + str(i+5),fontsize=16)
# plt.savefig("formatted/"+date+"/figure/"+str(i+5)def plot_and_save(sample,i=""):".svg",format="svg")
plt.show()es[1,0].set_ylabel("PSD")

cur_f, cur_psd = welch(df["Current"], fs=sampling_freq)
axes[1,1].plot(cur_f, cur_psd, marker="",color="yellow")
axes[1,1].set_title("Plot of Current's Power Spectral Density")
axes[1,1].set_xlabel("Frequency", ha= "right",x=1.0)
axes[1,1].set_ylabel("PSD")

axes[2,0].plot(df["Time"], df["Current"]*df["Voltage"], marker="",color="red")
axes[2,0].set_title("Plot of power against time")
axes[2,0].set_xlabel("Time (us)", ha= "right",x=1.0)
axes[2,0].set_ylabel("Watt")

sns.scatterplot(x="Current", y="Voltage", data=df, ax=axes[2,1], color = 'r', edgecolor="None", linewidth=0)
axes[2,1].set_title("Plot of Voltage against Current")
axes[2,1].set_xlabel("Current (A)", ha="right", x=1.0)
axes[2,1].set_ylabel("Voltage (V)")

fig1.suptitle("Sample number: " + str(i+5),fontsize=16)
# plt.savefig("formatted/"+date+"/figure/"+str(i+5)".svg",format="svg")
plt.show()
Thank you so much for the help!
