Follow up to the question here
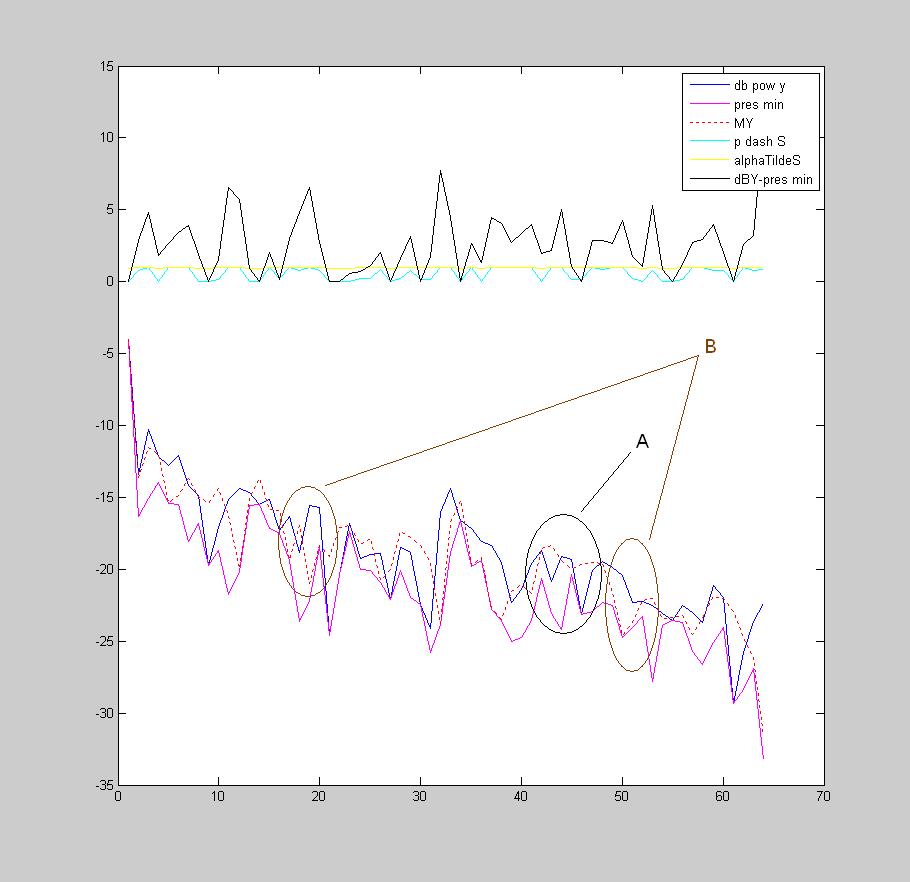
This is a screen shot of an intermediate step in the middle of my calculation

The dotted line called MY is supposed to be a smoothed version of db pow y db pow y is the magnitude squared represented in base 2 log scale, of the first half of a 128 point FFT In the every next iteration, I can see that db pow y changes drastically (it is the sound input data, so it may be anything at every step) while the graph for MY changes very very slightly
my question is , since MY is a smoothed version of db pow y, shouldn't it be running close to the graph of db pow y? I know that it will definitely not be closer to db pow y as it changes drastically at each iteration and MY changes very slightly, but I still do not understand exactly how this is supposed to work
Also, at points such as A in the graph above, the dotted line seems to "ignore" sharp variations in db pow y (as I would expect, since MY is smoothed version of db pow y), but then again, at positions such as B, the dotted line is the one changing drastically
Then, could you please explain to me how this is supposed to work?
This is the smoothing equation used:
    pDashS(i) = 0.2 * pDashS(i) + 0.8 * ((db_pow_y(i)-pres_minima(i)) > diff_between_db_pow_y_and_pres_min);
    alphaDTildS(i) = 0.95 + 0.05 * pDashS(i);
    MY(i) = alphaDTildS(i) * pastMY(i) + (1- alphaDTildS(i)) * db_pow_y(i);
    pastMY(i) = MY(i);
where i ranges from 1 to 64, half of a 128 point FFT
the actual line performing the smoothing is
MY(i) = alphaDTildS(i) * pastMY(i) + (1- alphaDTildS(i)) * db_pow_y(i);
which, from what I understand from answers to my previous questions, this is an example of a low pass IIR filter which performs smoothing on db_pow_y and alphaDTildS is the smoothing parameter
Please help
Thank you
(PS: code is in Matlab)
