1
$\begingroup$

I am trying to better understand zero padding and the FFT. To do so, I am attempting to plot the spectrum of the Hann window function, i.e.

$$ w(n) = \frac{1}{2}\left(1-\cos\left(\frac{2\pi (n+1/2)}{N}\right)\right) $$

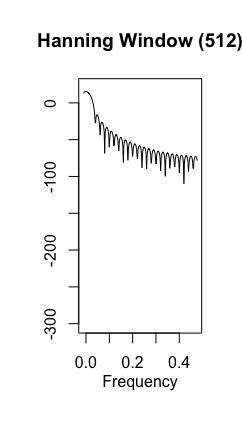
To accomplish this, I did the following: 1) I created a series of points $n=0,1,...,49$ that I substituted into the hamming window function to get $w(n)$, 2) I zero-padded the data to $M=512$ to get $x(n)$, 3) I used the FFT function in R to compute the Fourier transform of $x(n)$, 4) I calculated the magnitude squared of the Fourier transform obtained in part 3). This gave me the following result:

enter image description here

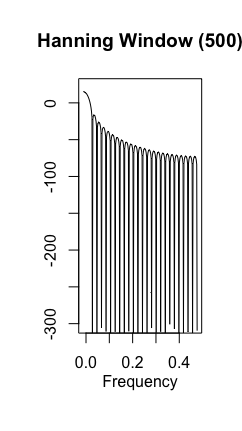
I then repeated the above steps, but with $M=500$ instead of $M=512$ (i.e. I zero-padded to 500 instead of 512). This gave me the following result:

enter image description here

Why are these two spectra so different? Everything that I have read about the FFT seems to say that I should choose $M$ to be a power of 2 in order to reduce computation time. But I haven't found anything that explains why the spectrum should change as it does.

Any help would be appreciated... thanks!

$\endgroup$
5
  • 1
    $\begingroup$ Possible duplicate of Why do we say that "zero-padding doesn't really increase frequency resolution" $\endgroup$
    – MBaz
    Commented Mar 22, 2017 at 1:42
  • $\begingroup$ Why are you zero-padding at all? My suggestion is to increase the number of true samples of the signal, so that you can get a spectrum with more actual resolution. $\endgroup$
    – MBaz
    Commented Mar 22, 2017 at 1:43
  • $\begingroup$ @MBaz Thanks for your comment. I am new to time series, so I was doing this as an exercise to better understand zero padding and the FFT. I really don't understand why the minima in the above spectra would be so different when zero padding to 500 vs. 512. Is this difference due to the length of the time series? $\endgroup$
    – Michael R
    Commented Mar 22, 2017 at 2:27
  • 1
    $\begingroup$ My guess would be that it is a result of the different spectral leakage produced by the varying resolution. Basically, if you align the nulls of the "true" spectrum with your frequency bin centers, you'll get much more pronounced nulls in the spectrum. $\endgroup$
    – MBaz
    Commented Mar 22, 2017 at 2:36
  • $\begingroup$ MBaz's answer is correct. Also note that for most purposes, the approximately -100 dB dips that you see in the first plot aren't all that different numerically from the -300 dB dips in the second. Both represent really small numbers. In most applications, if you want something to be attenuated by a good amount, you won't notice much of a difference between -100 and -300 dB. $\endgroup$
    – Jason R
    Commented Mar 22, 2017 at 19:57

3 Answers 3

1
$\begingroup$

Another way to look at this involves frequency domain aliasing due to time-domain sampling of a non-bandlimited function. The prototypical continuous-time Hann window function is (Fig. 1):

$$f(x) = \cases{\frac{1}{2}-\frac{1}{2}\cos(\pi x)&if $-1 < x < 1,$\\0&otherwise.}$$
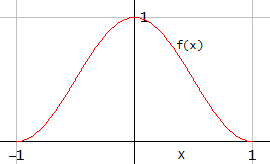
Prototypical Hann window
Figure 1. The prototypical continuous-time Hann window function.

It is related to your $w(n)$ by:

$$w(n) = f\left(\frac{2n}{N-1}-1\right).$$

The Fourier transform (with angular frequency $\omega$) of $f(x)$ is:

$$\begin{align}F(\omega) &= \int_{-1}^{1}f(x)e^{-i\omega x}\\&= \int_{-1}^{1}\frac{1}{2}(1-\cos(2\pi x))e^{-i\omega x}\\&= \frac{1}{2}\operatorname{sinc}(\omega+\pi) + \operatorname{sinc}(\omega) + \frac{1}{2}\operatorname{sinc}(\omega-\pi),\end{align}$$

with this convenience definition of the sinc function (often you'd see $\pi \omega$ instead of $\omega$):

$$\operatorname{sinc}(\omega) = \cases{1 &if $\omega = 0,$\\ \frac{\sin(\omega)}{\omega}&otherwise.}$$

The Fourier transform consists of shifted and scaled sinc functions, because $f(x)$ is the product of three complex exponential functions (complex sinusoids) and a rectangular function. The frequency domain counterpart of this is convolution of a sum of three shifted and scaled Dirac delta functions by a sinc function. The sinc function (by the above definition) is zero-valued at all integer multiples of $\pi$ except for at $\omega = 0$, and nowhere else. Likewise, $F(\omega)$ is zero-valued at integer multiples of $\pi$ except for at $\omega \in \{-\pi, 0, \pi\}$, and nowhere else (Fig. 2):

Fourier transform of Hann window
Figure 2. Absolute value of the Fourier transform of the prototypical continuous-time Hann window in dB scale. The horizonal axis is shown in multiples of $2\pi.$ All notches are true zeros.

The tails of $F(\omega)$ go on forever, so $f(x)$ is not bandlimited. When $f(x)$ is sampled this will result in frequency domain aliasing. If $f(x)$ was sampled directly with a sampling period of $1$, the aliasing would be around Nyquist frequency $\omega = \pi$ (the first gray gridline), but based on Eq. 1, you are sampling it more densely with a period $\frac{2}{N-1}$ in $x$, which means aliasing around $\omega =$ $ \pi/\frac{2}{N-1} =$ $ (N-1)\frac{\pi}{2}.$ As long as $N$ is an integer, all unaliased zeros will coincide with aliased zeros. They will thus remain zeros. For example $N = 9$ sees aliasing around $\omega=4\pi$ (Fig. 3):

Aliased F(omega)
Figure 3. Aliased spectrum of a sampled Hann window $w(n)$ with $N = 9$. The horizontal axis is the angular frequency $\omega$ with respect to $x$ shown in multiples of $2\pi.$

Because $f(x)$ was defined for the complete real line, the sampled window $w(n)$ is zero-padded both ways to eternity. Its aliased spectrum illustrated in Fig. 3 will be sampled by the discrete Fourier transform (DFT) with a uniform grid of $M$ samples inclusive of the first sample at $\omega = 0$ and exclusive of a one-beyond-last sample at the sampling frequency $\omega = (N-1)\pi.$ Considering that zeros still appear only at values of $\omega$ that are integer multiples of $\pi$, if the factor $M / (N-1)$ is an integer, then all the zeros of the spectrum will be included in the frequency sampling, resulting in your second figure (Hanning window 500). Otherwise, DFT might miss (sometimes barely) some of the zeros. Looks like you had $N=51$, because $500/50 = 10$ is an integer.

$\endgroup$
2
$\begingroup$

500 is an exact integer multiple of the period of the cosine function used in your raised cosine window. Therefore there are zeros in the spectrum at all multiples of the cosine's frequency (due to those basis vectors being exactly orthogonal). 512 is not an integer multiple of that cosine's period, so none of the correlations against the DFT basis vectors of a 512 length FFT will be zero (just small). Thus the difference between the two spectrums.

$\endgroup$
1
$\begingroup$

The Hann windowing function (all windowing functions) are generally continuous time functions truncated to the desired length with a unit rectangle function. That is the true, full, continuous function for which a continuous Fourier transform will yield a smooth function that gives infinite resolution about at all frequencies. A lack of a windowing function, as an aside, is actually the Dirichlet windowing function, a rectangular window.

When you discretize the window, it is now a truncated series of impulses which should first be analyzed as a series of delayed $\delta$ functions, delayed by $e^{kT}$ for each one, which forms the continuous spectrum of the discretized window. If they are centered on the windowing function, and it's a symmetrical windowing function, then the $e^{-kT}$ all match up with a $e^{kT}$ to yield a simple cosine series.

Using the zero-padded DFT to analyze the spectrum will then suffer double truncation because it creates the function (Hann function here) in a circular spectrum. So zero-padding is actually the act of changing the "duty cycle" of the original function from 1.0 (no padding) to whatever you saw in the various padding exercises.

The reference by @MBaz to the discussion on zero-padding gets an upvote from me. Unfortunately, the circular nature of the DFT is lost in many conversations. and this question really focuses on the windowing function analysis that seems to be your task prompting this question.

I typically analyze the windowing function using a series of cosines in a spreadsheet to get as fine-grained a view of the function as I need. DFTs are for the bulk of normal continuous processing. I generally stay away from them for design analysis of signals and functions.

The windowing function is most often used in conjunction with a DFT and it is easy to forget that the real world has frequencies that don't fall on the bins evenly, so if you put a $e^\pi$ Hz signal in, you will see the stopband dance around due to that frequency not nicely aligning with the DFT time duration.

Thus different results, not only for padding ... but also for different phases of a static signal like an off-frequency input.

$\endgroup$

Your Answer

By clicking “Post Your Answer”, you agree to our terms of service and acknowledge you have read our privacy policy.

Not the answer you're looking for? Browse other questions tagged or ask your own question.