We are using a 16-bit DAC for a waveform generation between to $500\textrm{ MHz}$ with the sampling frequency of $1200\textrm{ MHz}$. The specification for the waveform generation is $10\textrm{ Hz}$ frequency resolution throughout the band $>60\textrm{ dB}$ SFDR. The spectral performance of the DAC is fine (more than $65\textrm{ dB}$ SFDR) for the frequencies which is satisfying the condition:
$$\frac{F_s}{F}=k \quad\big\vert\quad k\in \mathbb Z$$
The frequencies which is not satisfying the above condition yields some spurious which is not meeting my SFDR specification. Since the samples of every cycle will not be same, it's creating an envelope over the waveform, due to a phase values repeating itself periodically over a number of cycle. This envelope causing a spurious.
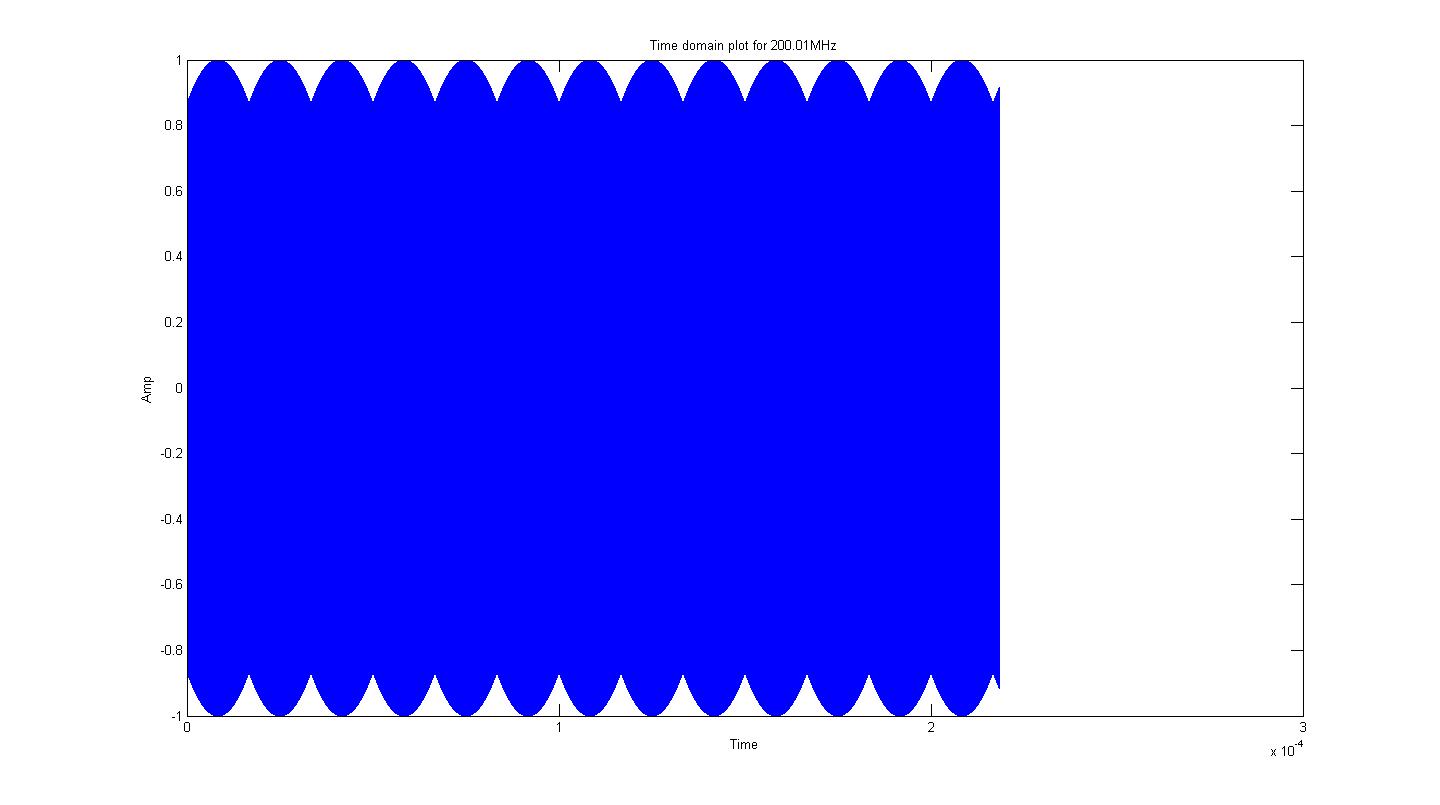
If we generate a frequency of $200.01\textrm{ MHz}$ in MATLAB with $F_s = 1.2\textrm{ GHz }$, we can clearly notice the envelope with periodic time period of $16.65\textrm{ $\mu$s}$ ($60\textrm{ kHz}$). The figure below is the MATLAB time-domain plot for $200.01\textrm{ MHz}$.
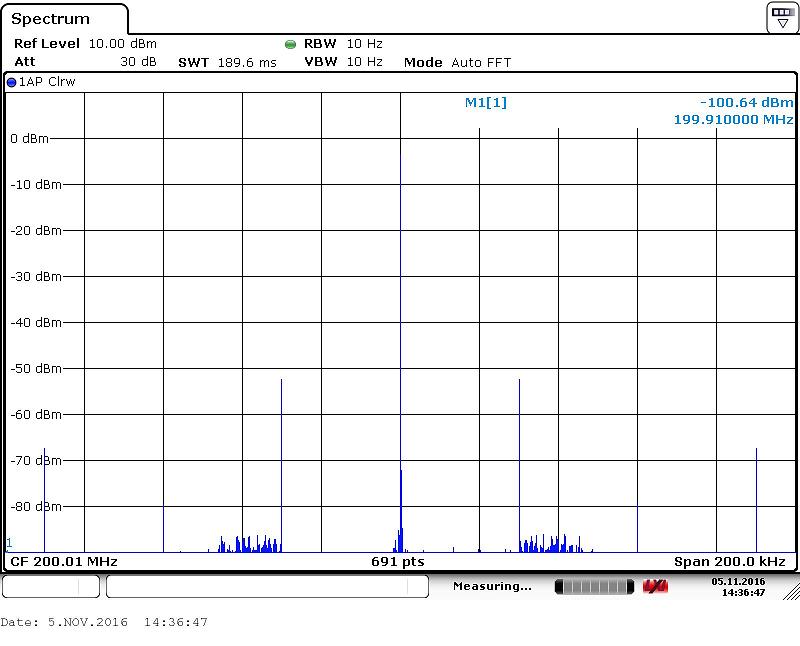
With my DAC, I'm getting a spurious at $\pm 60\textrm{ kHz}$ and $\pm 30\textrm{ kHz}$ apart from my generated frequency($F$).
The image below is the DAC output spectrum for $200.01\textrm{ MHz}$ captured with spectrum analyzer.
Is the spurious observed is due to the envelope?
MATLAB Simulation Code;
Fs = 1200e6;    %Sampling Frequency
T = 1/Fs;       % Clock Period
N = 2^18;       % No. of samples
t = (0:N-1)*T;  % Linear time interval
F = 200.01e6;   % Required Frequency
phase = 2*pi*F*t; % Consecutive Phase values in rad
sig = sin(phase); % Time Domain Signal
figure;
plot(t, sig), xlabel('Time in Sec'), ylabel('Amp'), title('Time Domain Plot for 200.01MHz');
wrap_phase = mod(phase, 2*pi);
figure;
plot(t,wrap_phase), xlabel('Time in Sec'), ylabel('Phase in rad'),           title('Phase values for 200.01MHz');
Suggestions are greatly appreciated.
Loganathan N


