0
$\begingroup$

I was working on simulation of steam turbine vibration under unbalance condition. I wish to perform an FFT for the vibration velocity (mm/s) respond and plot the frequency on the x-axis and the real amplitude on the y-axis. The respond vibration velocity data can be downloaded here: https://drive.google.com/open?id=0B21C655TFYWJSVFjY1VPeVg0WHM

I am using the following MATLAB code:

Fs =1000; % Sample Frequency
ti = 0:0.001:15;

ti= ti';
data = signal;   
N = length(data);

Y(1)=0;
Y=fft(signal);  
freq = 0:Fs/N:Fs/2-Fs/N;    
freq = freq';  
amplitude = abs(Y(1:floor(N/2)))/floor(N/2);

subplot(211)  
plot(ti,data)
xlabel('Time[s]')
ylabel('Amplitude')  
title ('Time domain signal')  
grid on

subplot (212) 
plot(freq,amplitude); 
xlabel('Frequency [Hz]');
ylabel ('Amplitude');
title('Amplitude Spectrum') 
grid on

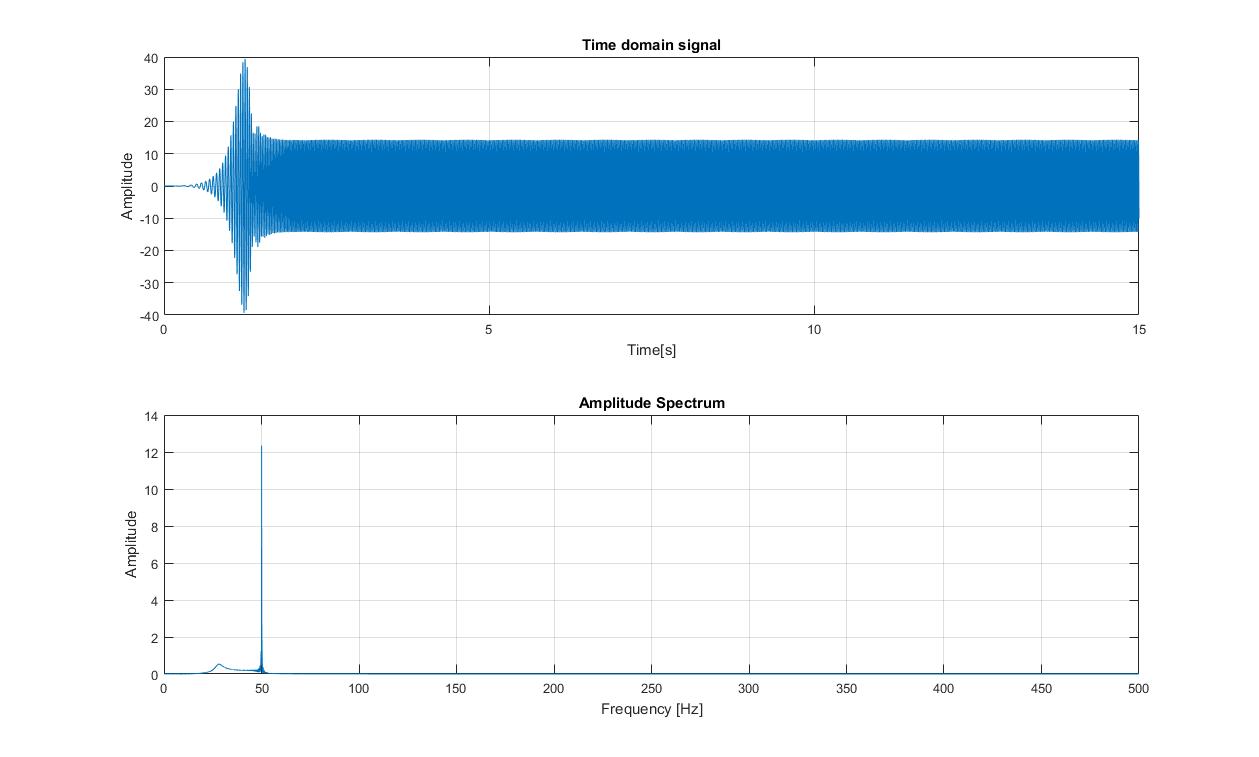
when executed the code this is what I've got

The time in "time domain signal" was corresponding to increased the rotation load of the rotor . For example at time 0-2 second the rotor RPM was increasing , so the unbalance force will excite the system which is lead to greater amplitude. after the 2s the rotor has reached the maximum load , so the amplitude decreased because the presented of damping inside the system from the time domain the max peak was in 39.42 mm/s at time 1.248, and then the amplitude goes down and stable with average in 14 mm/s at the rest of the time. I Thought it will give me two spikes at frequency domain with exactly the same amplitude in y-axis which is given above

Why I didn't get the spectrum signal as I wanted, Can someone please help me? Thanks.

$\endgroup$
4
  • $\begingroup$ Would it be possible to add a few more details about the signal please? For example, the units "mm/s" are mentioned but not the source of the signal (accelleration?). Also, the "time domain" signal, is that the response to a chirp signal? In the meantime, you might want to have a look at the concept of the spectrogram. $\endgroup$
    – A_A
    Commented Nov 22, 2016 at 22:59
  • $\begingroup$ Actually ,it was signal respond from my simulation . I was modelling vibration of steam turbine rotor under unbalance condition. And the signal which is upload above were the vibration velocity respond. $\endgroup$ Commented Nov 22, 2016 at 23:24
  • 1
    $\begingroup$ Thank you, this is valuable information to receiving a better answer and it would be best if it appeared in the body of the question. So, is this the vibration as the rotor spools up and after approximately 1.5-2.0 seconds it reaches max RPM? $\endgroup$
    – A_A
    Commented Nov 22, 2016 at 23:35
  • $\begingroup$ the time in "time domain signal" was corresponding to increased the rotation load of the rotor . For example at time 0-2 second the rotor RPM was increasing , so the unbalance force will excite the system which is lead to greater amplitude. after the 2s the rotor has reached the maximum load , so the amplitude decreased because the presented of damping inside the system. $\endgroup$ Commented Nov 22, 2016 at 23:36

1 Answer 1

1
$\begingroup$

The reason why you do not get "...two spikes at frequency domain with exactly the same amplitude in y-axis which is given above...", is because the Discrete Fourier Transform attempts to decompose the given signal as a whole.

Given the explanation about the origin of the signal, it is very similar to that of a chirp and the chirp's spectrum is not too far away from what you get, provided of course that one accounts for the envelope shape and the fact that in your waveform, the steady state is much longer than the transient (spooling up) and this explains the strong spike at 50Hz.

If you wanted to track the amplitude of the oscillation that is caused by the imbalance with respect to time (or load), then you would have to use the Short Time Discrete Fourier Transform which is nothing more than evaluating a shorter length Discrete Fourier Transform over (potentially overlapping) windows. For example, given some $x[n]$ with $N$ samples, you could $\mathcal{F}(x[0 \ldots 255]), \mathcal{F}(x[128 \ldots284]), \ldots $. This would run a series of 256 point FFTs with 50% overlap.

Eventually, this brings us to the spectrogram. The spectrogram is the depiction of the above process where the $x$ axis now corresponds to time and the $y$ axis corresponds to frequency. The "colour dimension" represents the amplitude of a given frequency present in a signal frame.

So, in the case of your signal and assuming a constant amplitude "disturbance" across the full range of RPM, you would observe a Spectrogram with a ramp in the beginning (spool up) followed by a constant line. The slope of the ramp is equal to the rate by which the rotor spools up.

However, the "disturbance" here is not constant and it presents resonance at specific frequencies / RPMs. Therefore, if you were to run a spectrogram on this particular signal here, you would still get the ramp but with a very intense low end (at the resonant frequencies) followed by a constant amplitude line at the steady state.

For more information on how to run a Spectrogram in MATLAB, please see this link.

Hope this helps.

$\endgroup$
3
  • $\begingroup$ @bagusmahartana You are welcome. Please note that you can accept or upvote this answer via the arrows and check-mark on the left of the answer, if you found it helpful. $\endgroup$
    – A_A
    Commented Nov 23, 2016 at 0:26
  • $\begingroup$ I've read your suggestion, and I've no idea for all of it. Can I just perform an FFT for the specific frequency, for example , I just want to obtain the spectrum at 0 until 2 seconds. $\endgroup$ Commented Nov 23, 2016 at 0:53
  • $\begingroup$ Then, given your sampling frequency $F_s$ which here is assumed an integer, and your sample duration $T_s$ which here is given in seconds, you can extract the first $T_s \cdot F_s$ samples from your signal and work on them. Please note, if you are still expecting to see "two peaks" in the spectrum of a single FFT, that is not going to happen for the reasons explained in the text. Hope this helps. $\endgroup$
    – A_A
    Commented Nov 23, 2016 at 8:46

Your Answer

By clicking “Post Your Answer”, you agree to our terms of service and acknowledge you have read our privacy policy.

Not the answer you're looking for? Browse other questions tagged or ask your own question.