added 526 characters in body
Source Link

I was working on simulation of steam turbine vibration under unbalance condition. I wish to perform an FFT for the vibration velocity (mm/s) respond and plot the frequency on the x-axis and the real amplitude on the y-axis. The respond vibration velocity data can be downloaded here: https://drive.google.com/open?id=0B21C655TFYWJSVFjY1VPeVg0WHM

I am using the following MATLAB code:

Fs =1000; % Sample Frequency
ti = 0:0.001:15;

ti= ti';
data = signal;   
N = length(data);

Y(1)=0;
Y=fft(signal);  
freq = 0:Fs/N:Fs/2-Fs/N;    
freq = freq';  
amplitude = abs(Y(1:floor(N/2)))/floor(N/2);

subplot(211)  
plot(ti,data)
xlabel('Time[s]')
ylabel('Amplitude')  
title ('Time domain signal')  
grid on

subplot (212) 
plot(freq,amplitude); 
xlabel('Frequency [Hz]');
ylabel ('Amplitude');
title('Amplitude Spectrum') 
grid on

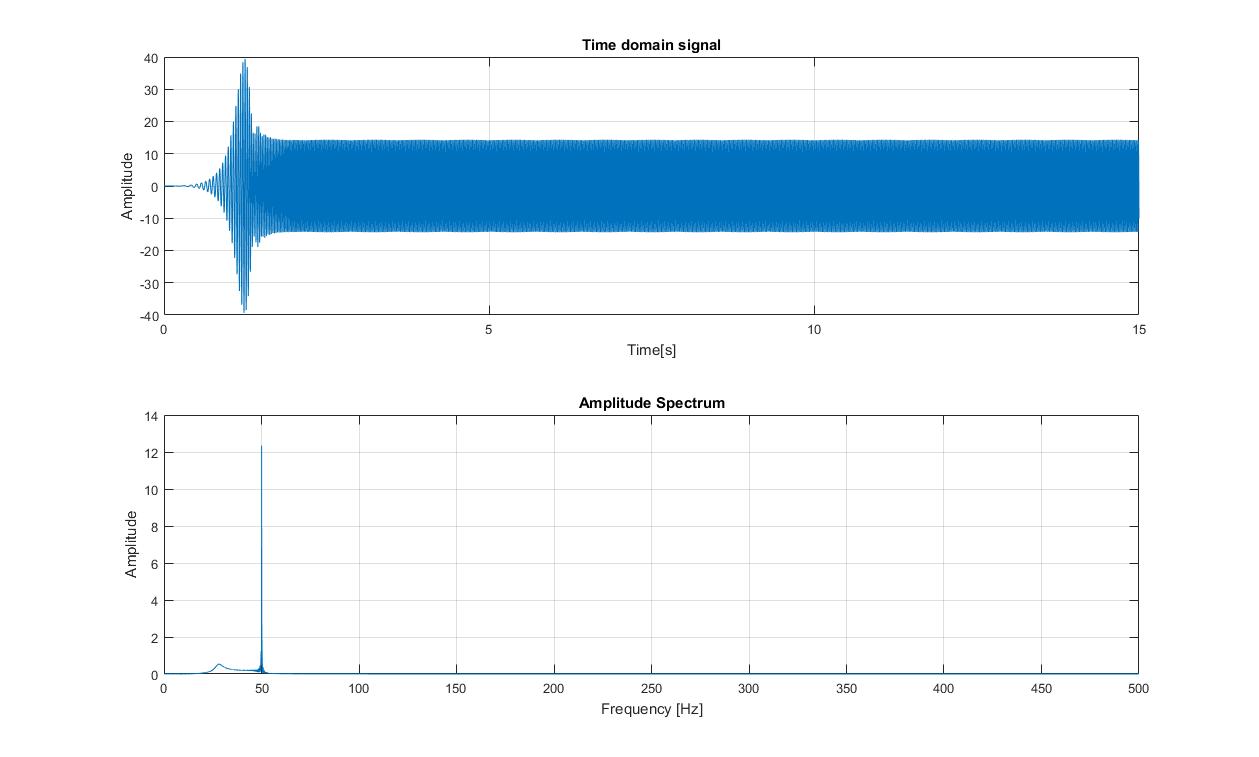
when executed the code this is what I've got

fromThe time in "time domain signal" was corresponding to increased the rotation load of the rotor . For example at time 0-2 second the rotor RPM was increasing , so the unbalance force will excite the system which is lead to greater amplitude. after the 2s the rotor has reached the maximum load , so the amplitude decreased because the presented of damping inside the system from the time domain the max peak was in 39.42 mm/s at time 1.248, and then the amplitude goes down and stable with average in 14 mm/s at the rest of the time. I Thought it will give me two spikes at frequency domain with exactly the same amplitude in y-axis which is given above

Why I didn't get the spectrum signal as I wanted, Can someone please help me? Thanks.

I wish to perform an FFT and plot the frequency on the x-axis and the real amplitude on the y-axis. The data can be downloaded here: https://drive.google.com/open?id=0B21C655TFYWJSVFjY1VPeVg0WHM

I am using the following MATLAB code:

Fs =1000; % Sample Frequency
ti = 0:0.001:15;

ti= ti';
data = signal;   
N = length(data);

Y(1)=0;
Y=fft(signal);  
freq = 0:Fs/N:Fs/2-Fs/N;    
freq = freq';  
amplitude = abs(Y(1:floor(N/2)))/floor(N/2);

subplot(211)  
plot(ti,data)
xlabel('Time[s]')
ylabel('Amplitude')  
title ('Time domain signal')  
grid on

subplot (212) 
plot(freq,amplitude); 
xlabel('Frequency [Hz]');
ylabel ('Amplitude');
title('Amplitude Spectrum') 
grid on

when executed the code this is what I've got

from the time domain the max peak was in 39.42 mm/s at time 1.248, and then the amplitude goes down and stable with average in 14 mm/s at the rest of the time. I Thought it will give me two spikes at frequency domain with exactly the same amplitude in y-axis which is given above

Why I didn't get the spectrum signal as I wanted, Can someone please help me? Thanks.
I was working on simulation of steam turbine vibration under unbalance condition. I wish to perform an FFT for the vibration velocity (mm/s) respond and plot the frequency on the x-axis and the real amplitude on the y-axis. The respond vibration velocity data can be downloaded here: https://drive.google.com/open?id=0B21C655TFYWJSVFjY1VPeVg0WHM

I am using the following MATLAB code:

Fs =1000; % Sample Frequency
ti = 0:0.001:15;

ti= ti';
data = signal;   
N = length(data);

Y(1)=0;
Y=fft(signal);  
freq = 0:Fs/N:Fs/2-Fs/N;    
freq = freq';  
amplitude = abs(Y(1:floor(N/2)))/floor(N/2);

subplot(211)  
plot(ti,data)
xlabel('Time[s]')
ylabel('Amplitude')  
title ('Time domain signal')  
grid on

subplot (212) 
plot(freq,amplitude); 
xlabel('Frequency [Hz]');
ylabel ('Amplitude');
title('Amplitude Spectrum') 
grid on

when executed the code this is what I've got

The time in "time domain signal" was corresponding to increased the rotation load of the rotor . For example at time 0-2 second the rotor RPM was increasing , so the unbalance force will excite the system which is lead to greater amplitude. after the 2s the rotor has reached the maximum load , so the amplitude decreased because the presented of damping inside the system from the time domain the max peak was in 39.42 mm/s at time 1.248, and then the amplitude goes down and stable with average in 14 mm/s at the rest of the time. I Thought it will give me two spikes at frequency domain with exactly the same amplitude in y-axis which is given above

Why I didn't get the spectrum signal as I wanted, Can someone please help me? Thanks.

Source Link

How do I get excatly the same peak amplitude versus frequency when performing FFT?

I wish to perform an FFT and plot the frequency on the x-axis and the real amplitude on the y-axis. The data can be downloaded here: https://drive.google.com/open?id=0B21C655TFYWJSVFjY1VPeVg0WHM

I am using the following MATLAB code:

Fs =1000; % Sample Frequency
ti = 0:0.001:15;

ti= ti';
data = signal;   
N = length(data);

Y(1)=0;
Y=fft(signal);  
freq = 0:Fs/N:Fs/2-Fs/N;    
freq = freq';  
amplitude = abs(Y(1:floor(N/2)))/floor(N/2);

subplot(211)  
plot(ti,data)
xlabel('Time[s]')
ylabel('Amplitude')  
title ('Time domain signal')  
grid on

subplot (212) 
plot(freq,amplitude); 
xlabel('Frequency [Hz]');
ylabel ('Amplitude');
title('Amplitude Spectrum') 
grid on

when executed the code this is what I've got

from the time domain the max peak was in 39.42 mm/s at time 1.248, and then the amplitude goes down and stable with average in 14 mm/s at the rest of the time. I Thought it will give me two spikes at frequency domain with exactly the same amplitude in y-axis which is given above

Why I didn't get the spectrum signal as I wanted, Can someone please help me? Thanks.