Excuse my silly question, but I think the energy increases as the sampling rate increases. In the time domain, the number of samples increases so the energy increases; In the frequency domain, doubling the sampling rate also increases the amplitude of the spectrum, thus doubling the energy. But the sampling rate doesn't affect the power, right? So why is energy equal to power multiplies sampling time? The power stays the same, the sampling time stays the same, so if you increase the sampling rate why would you double the energy?
-
$\begingroup$ First thing, you should learn what the difference is between what a finite-energy signal and a finite-power signal is. And this is what energy/power density in the spectrum is. $\endgroup$– robert bristow-johnsonCommented Dec 13, 2022 at 2:56
2 Answers
As rb-j alludes to in the comments, it's helpful to be clear about what is meant by energy.
When sampling a continuous-time signal, there is a time period between each sample: the sampling period.
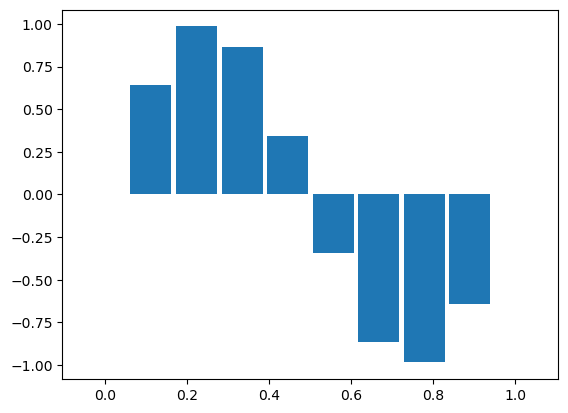
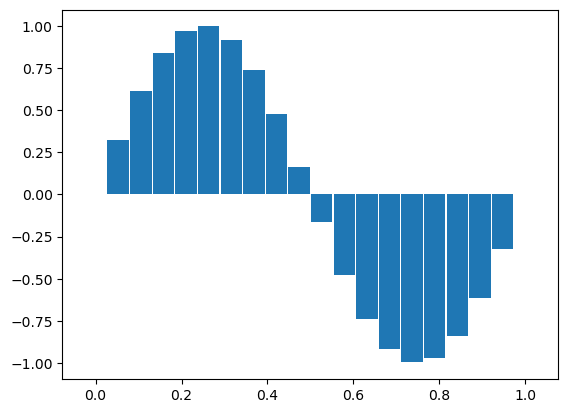
For example a sine wave can be sampled and plotted:
import numpy as np
import matplotlib.pyplot as plt

N1 = 10
N2 = 20

t1 = np.linspace(0,1,N1)
t2 = np.linspace(0,1,N2)

x1 = np.sin(2*np.pi*t1)
x2 = np.sin(2*np.pi*t2)

plt.figure(1)
plt.bar(t2,x2, 1/N2)
plt.figure(2)
plt.bar(t1,x1, 1/N1)
this is the same sine wave, but it's sampled at two different sampling frequencies.
I've plotted the two in a different way than I would normally: using a bar graph. The reason I've done this is it makes the answer to your question a little clearer.
The energy of the underlying continuous-time signal is the same in both cases. To calculate the energy, it's necessary to integrate the square of the value of the signal.
In the discrete-time case this means summing the areas of each of the bars. As you can see, when there are twice as many bars over the same time period, the width of each bar is halved, so the contribution to the energy is halved.
There will be some inaccuracy due to the discretization done, which I've not accounted for in this explanation.
-
1$\begingroup$ I think OP's saying $E = \sum |x|^2$ yet also $E = P \cdot T$, so worth noting they're for different things. $\endgroup$ Commented Dec 13, 2022 at 14:30
The following two sections are meant to be read last, made first for convenience.
Relevant results & summary
$$ \begin{align} P_\text{physical}[n] = P_\text{discrete}[n] &= |x[n]|^2 \\ \bar{P}_\text{physical} \approx \bar{P}_\text{discrete} &= \sum_{n=0}^{N - 1} |x[n]|^2 / N \\ E_\text{physical} \approx E_\text{discrete} / f_\text{sampling} &= \sum_{n=0}^{N - 1} |x[n]|^2 / f_\text{sampling} \\ E_\text{discrete} &= \sum_{n=0}^{N - 1} |x[n]|^2 \\ E_\text{physical}[n] = E_\text{discrete}[n] &= 0 \end{align} $$
(I'm not 100% on $E_\text{discrete}[n] = 0$, e.g. $N=1$, but I'll leave it here. Physical is $0$ though.)
Effects of sampling rate
$\uparrow f_\text{sampling}$ yields
$$ \begin{align} & \uparrow E_\text{discrete} \\ & \circ E_\text{physical} \\ & \circ \bar{P}_\text{discrete} \\ & \circ \bar{P}_\text{physical} \\ \end{align} $$
with caveat that, increased $f_\text{sampling}$ may reduce aliasing and change the quantities unpredictably. $\circ$ means no change.
Physical vs Discrete
Is the root of confusion. Indeed, discrete energy increases with greater sampling rate, but the energy of the underlying continuous function remains same. Consider $\cos(2\pi t)$ for $0 \leq t \leq 1$:
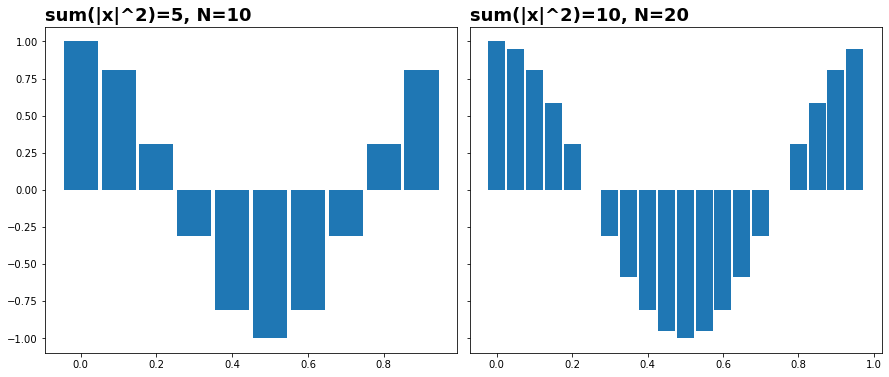
This is simply Riemann integration. To convert, we account for the sampling period:
$$ \begin{align} E_\text{physical} &\approx E_\text{discrete} \cdot T_\text{sampling} \\ &= E_\text{discrete} / f_\text{sampling} \\ \end{align} $$
Sampling period is just the bin width. A great convenience is, when done over an integer number of periods, it exactly matches the continuous-time result, for any number of bins; note $\int_0^1 |\cos(2\pi t)|^2 dt = 0.5$.
Further, we must account for duration, since doubled frequency and doubled duration are identical from the discrete point of view:
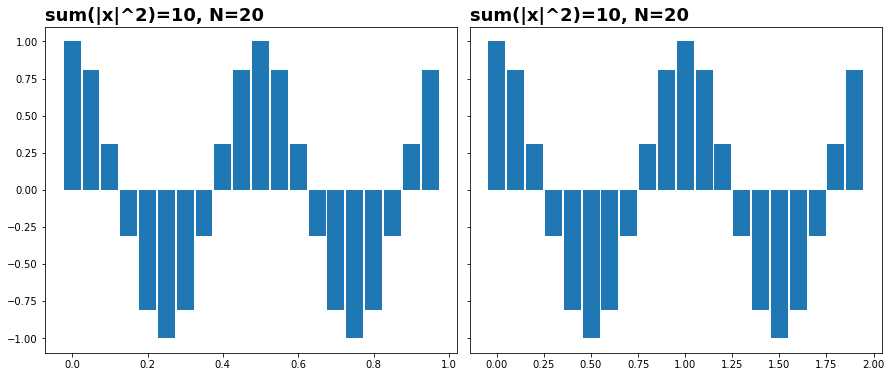
yet any frequency over the same continuous duration has the same energy. The physical energy is double in the right plot compared to left. Luckily, the sampling period takes care of this. A discrete sequence simply doesn't encode physical duration, and it must be specified externally. For mean power, where $T = T_\text{sampling} \cdot N$ is total duration, we thus have
$$ \begin{align} \bar{P}_\text{physical} &= E_\text{physical} / T \\ &= E_\text{discrete} / N \\ \end{align} $$
... but it's inexact!
Note I used $\approx$. While the power at $x[n]$ is exactly $|x[n]|^2$, as energy is by definition aggregate${}^1$, an operation over an interval necessarily makes use of what's between $x[n]$ and $x[n + 1]$, and the $T_\text{sampling}$ in $E_\text{discrete} \cdot T_\text{sampling}$ is an interval. And that's subject to aliasing:
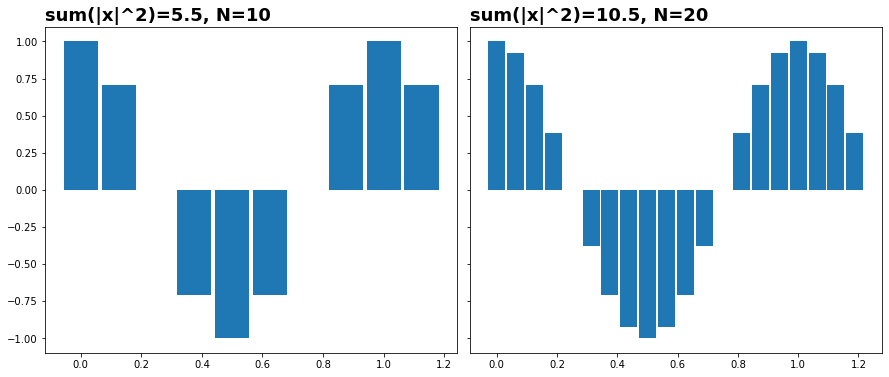
Here $T = 1.25$, so on left we have $5.5 / 10 \cdot 1.25 = 0.6875$, and on right $10.5 / 20 \cdot 1.25 = 0.65625$, yet the true value is $\int_0^{1.25} |\cos(2\pi t)|^2 dt = 0.625$. $N=20$ is closer as higher sampling rate reduces aliasing.
Aliasing? But I satisfied Nyquist!
Our $f_s=20/1.25 = 16 \text{Hz}$, and the cosine is $1 \text{Hz}$, what gives? While there's no "distortion" in typical sense of the word "alias", it still technically qualifies; copying from here:
A correct but incomplete point is, insufficient SR = can't recover perfectly, but insufficient observation interval can recover. Problem is, the insufficient interval must have a sufficient SR - what this actually requires, though, is for the interval to be long enough! That's because "sufficient SR" presumes "bandlimited", which is only satisfied with an infinite observation interval, or interval that captures an integer number of periods of a periodic input.
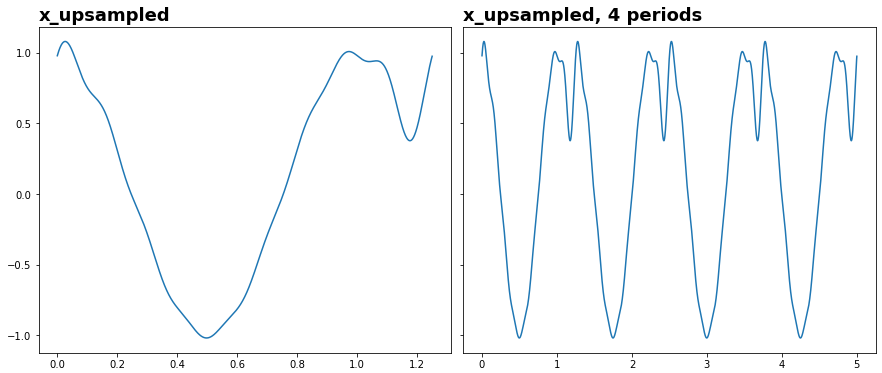
The effects of aliasing on energy are readily quantified via Parseval-Plancherel's theorem and the DFT. What's happening with our sine above is, as some put it, the DFT ""assumes"" input is periodic - meaning the infinite $x[n]$ periodically repeats our finite $x[n]$, so it's no longer the Fourier transform of $\cos(2\pi t)$, but of a cosine that restarts from $t=0$ after reaching $t=1.25$. We can see what the DFT sees by FFT upsampling:
1 (footnote)
That's following the definition of $|x(t)|^2$ as instantaneous power. Depending on units of $x$, it can be power, energy, or neither. But the definition is the way it is for good reasons:
Instantaneous energy?
Is zero. This may surprise, but it follows directly from definition - see footnote. But practically, even if $|x[n]|^2$ is instantaneous power, one could treat $|x[n]|^2 / f_\text{sampling}$ as instantaneous energy, treating $x[n]$ as capturing the "average" over the interval - i.e. it's assuming that $x(t)$ doesn't change much from $x[n]$ to $x[n + 1]$ - equivalently, the sampling rate is way above Nyquist. But this doesn't contradict the rest of the post - a sub-signal is still a signal, even if it's two points or one, and the "problem" is same, aliasing.
If $|x(t)|^2$ isn't power, physically
Often, it's energy, as in velocity of a car. In this case we can use $P(t) = d/dt E(t)$.
Here, we run into the same problem, as the derivative operates on intervals, even if its output is pointwise. Assuming no aliasing, "trigonometric differentiation" yields the exact derivative:
$$ \texttt{TRIGDIFF}(x[n]) = \texttt{iFFT} \left( jk^{*} \frac{2\pi}{N} \cdot \texttt{FFT}(x[n]) \right) $$
where $k^{*}$ is the signed $k$ of DFT (in FFT ordering), i.e.
N=128: [0, 1, 2, ..., 64, -63, -62, ..., -1]
N=129: [0, 1, 2, ..., 64, -64, -63, ..., -1]
It still provides an excellent approximation in cases of limited aliasing, and is used in synchrosqueezing -- relevant paper. Note similarity with the standard Fourier derivative property, $x'(t) \Leftrightarrow j\omega X(\omega)$.
Note the $x[n]$ in the formula should be $|x[n]|^2$ for energy, which will typically double the bandwidth and amplify aliasing; this can be remedied with CWT & STFT, at expense of temporal resolution - relevant article.
Answer code
Available at Github, partially for now.

