1
$\begingroup$

I am studying for my exam in signal processing. In one of the old exam papers I am told to find a sampling frequency, which will remove 80 Hz noise. The filter the exam question is based around has an impulse response $h[n]$ of

\begin{bmatrix} -3&0&-3&0 \end{bmatrix}

My approach is to just choose the sampling frequency at a multiple of the noise frequency. In this case, I would choose it to be 320 Hz, since 4 samples gives a sum of 0. When doing a DFT with the known impulse response it would also result in a net 0 frequency response.

Does this seem like a sustainable approach?

$\endgroup$

2 Answers 2

3
$\begingroup$

The general approach would be to find the zeros of the filter's transfer function. If you do things right it will turn out that there are two complex conjugate zeros on the unit circle at $\pm j$, i.e., at half the Nyquist frequency. Now you need to choose the sampling frequency such that $80$ Hertz corresponds to half the Nyquist frequency.

$\endgroup$
3
  • $\begingroup$ With the Nyquist frequency being half the sample frequency, shouldn’t 80 Hz be at Nyquist? If not, it seems that my result is correct but my approach is wrong? Because then, according to your answer, 80 Hz should be at Fs/4 which would make Fs=320 Hz $\endgroup$
    – Mag
    Commented Dec 29, 2020 at 18:44
  • $\begingroup$ @Mag: You're right that the correct answer is indeed $f_s=320$ Hz. I just showed you a general way of proving it. You might not always have an impulse response for which you can readily see the result. Note that $j=e^{j\pi/2}$, and since $\pi$ corresponds to Nyquist, $\pi/2$ corresponds to half the Nyquist frequency. $\endgroup$
    – Matt L.
    Commented Dec 29, 2020 at 18:49
  • $\begingroup$ I understand, thank you for taking the time to answer! $\endgroup$
    – Mag
    Commented Dec 29, 2020 at 18:50
4
$\begingroup$

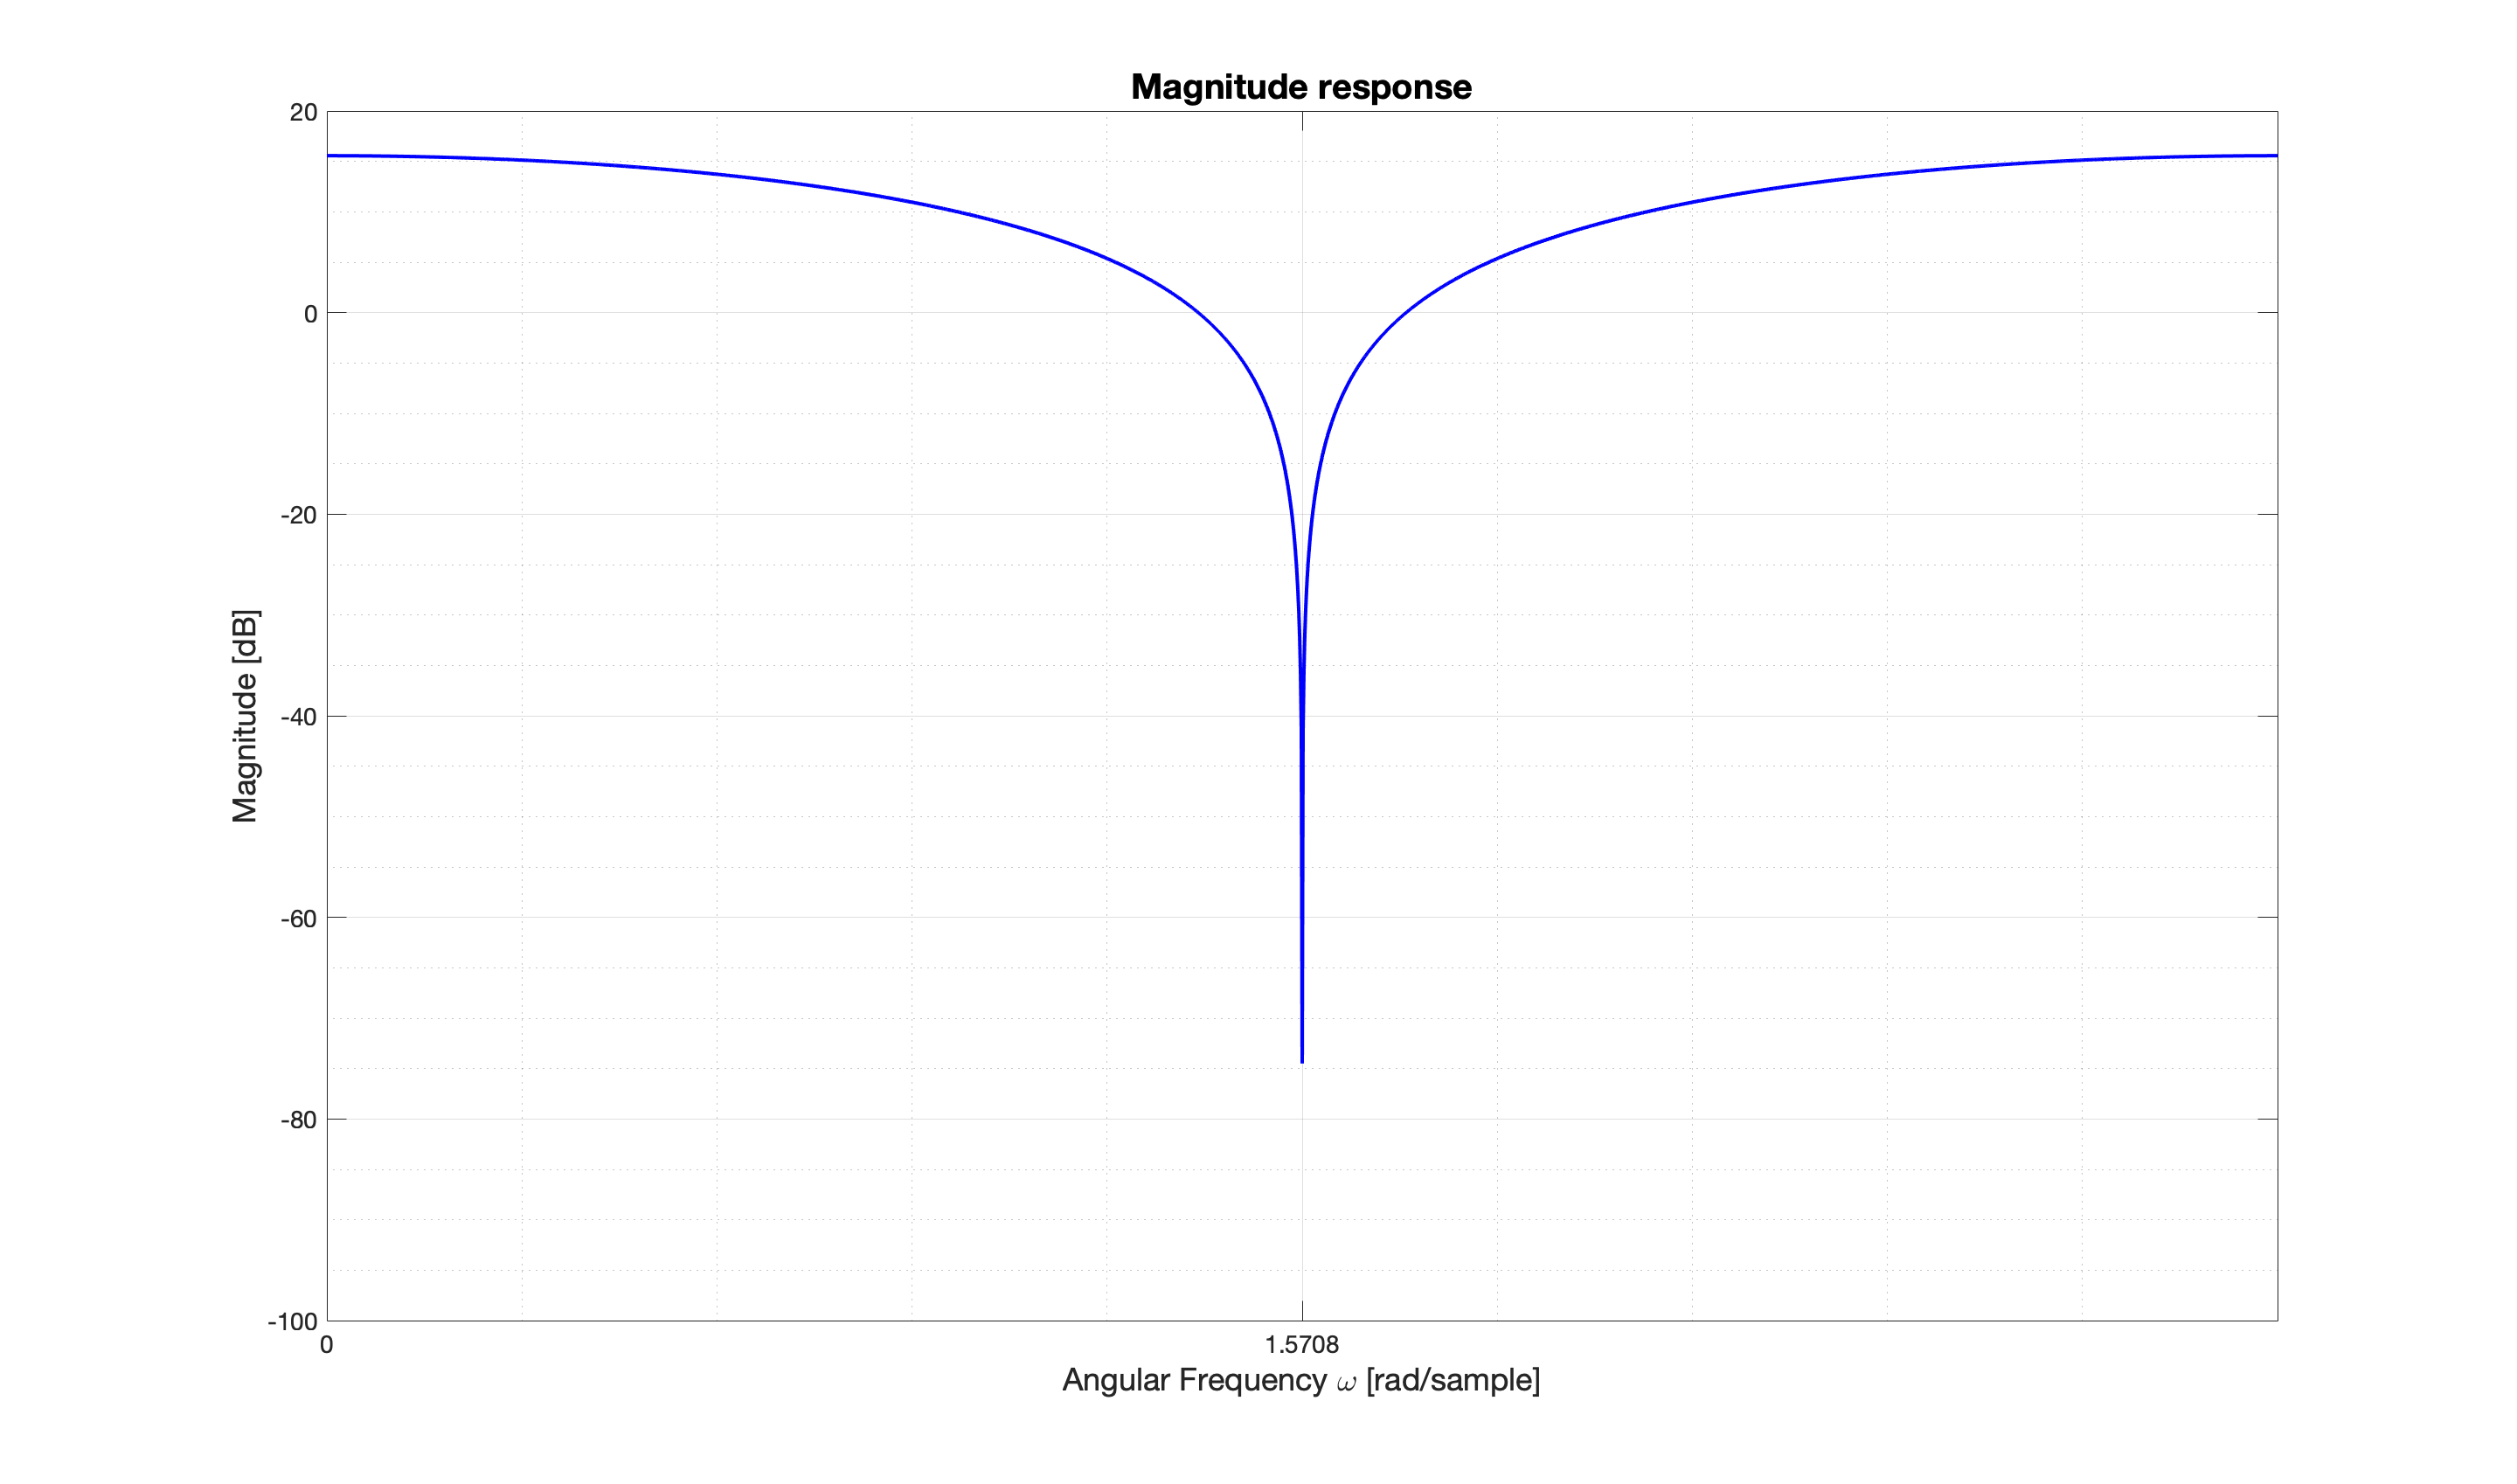
Or another way, visually, with the plot of the magnitude response of your filter shown below you see that it goes to zero at $\pi/2$.

enter image description here

So what you could do is use the relationship between the angular frequency $\omega$ in [radians/sample] and the relative frequency $f$ in [cycles/sample]

$$ \omega = 2\pi f = 2\pi \left(\frac FF_s\right) $$ Then compute $F_s$ for $F = 80 \ \rm Hz$ and $\omega = \pi/2$. You then get \begin{align} \frac \pi 2 &= 2\pi \left(\frac{80}{F_s}\right)\\ \implies \frac 12 &= 2\cdot \left(\frac{80}{F_s}\right) \\ \iff 80 &= \frac 12\cdot \left(\frac{F_s}{2}\right) \end{align}

Giving you the $320\ \rm Hz$.

In MATLAB

You can plot the magnitude response from the frequency response using MATLAB's freqz function where you can specify the frequency grid from $0$ to Nyquist (i.e. $\pi$). With your resulting $320\ \rm Hz$, you can run the function with this $F_s$ and see that $80\ \rm Hz$ is indeed suppressed.

$\endgroup$
2
  • $\begingroup$ How do you plot the magnitude response from the impulse response? I assume that you are doing it in MATLAB? $\endgroup$
    – Mag
    Commented Dec 29, 2020 at 19:04
  • 1
    $\begingroup$ @Mag please see my edit at the end. $\endgroup$
    – Gilles
    Commented Dec 29, 2020 at 20:45

Your Answer

By clicking “Post Your Answer”, you agree to our terms of service and acknowledge you have read our privacy policy.

Not the answer you're looking for? Browse other questions tagged or ask your own question.