0
$\begingroup$

I have a specific question with regards to the units of power spectral density (PSD): I have 2 codes, but my question is signal units specific:

Code1 (using MATLAB coding)

 [pxx1,freq1] = pwelch(sigstruct.SignalName.value,winsize,winsize/2,[],1/Ts,'onesided');
plot(freq1,10*log10(pxx1),'Color','r','LineWidth',1)

Here, Ts = sampling time, winsize = window size for PSD. Now, I also have a generic implementation of the pwelch function given in a repository. When I plot plot(freq1,10*log10(pxx1)) with the generic code of repository, the results exactly match the Code1, but the generic code actually plots this:

plot(freq, 10 * log10(yval) * (2 * pi / Fs));

The resulting units by plotting the above on y-axis are db/Hz, here Fs is the sampling frequency. What I am unable to understand is that why is a multiplication factor of (2 * pi / Fs) used here. Is it something to convert the units from db to db/Hz. What does this factor do and why is it required?

$\endgroup$
1
  • $\begingroup$ This is confusing. What is the “generic repo”? What is “yval”? Please give us something we can run. $\endgroup$
    – Jdip
    Commented Jul 27 at 11:56

1 Answer 1

1
$\begingroup$

It's a matter of what we want to use for the unit of frequency. The result returned by the Welch function was a power density in units of $W/Hz$ (or more likely a power ratio or any other unit of power besides $W$). Specifically it is a a power spectral density as some unit of power over a 1 Hz bandwidth. This was set by the parameter 1/Ts that was passed into the function assuming Ts is in units of seconds. So in this case the code was created to instead plot the resulting power spectral density as power over a unit bandwidth in units of radians/sample.

'(2 * pi / Fs)' converts units of Hz to normalized frequency in units of radians/sample. We often see this choice of units for frequency in digital signal processing and with it the DSP implementation can scale directly with the sampling rate (if we have a half-band filter for example, if we run it at twice the rate, it will still be a half-band filter).

An example where such a translation would be useful in this case is if we had a filter or region of spectrum that was given in units of radians per sample, where the entire bandwidth is given as $B$. Then from the power spectral density mapped to the same frequency units as $S(f)$, we can easily compute the total power in that bandwidth as $S(f) B$ (assuming $S(f)$ is constant over $B$ otherwise this would involve an integral over $B$ or piecewise approximation).

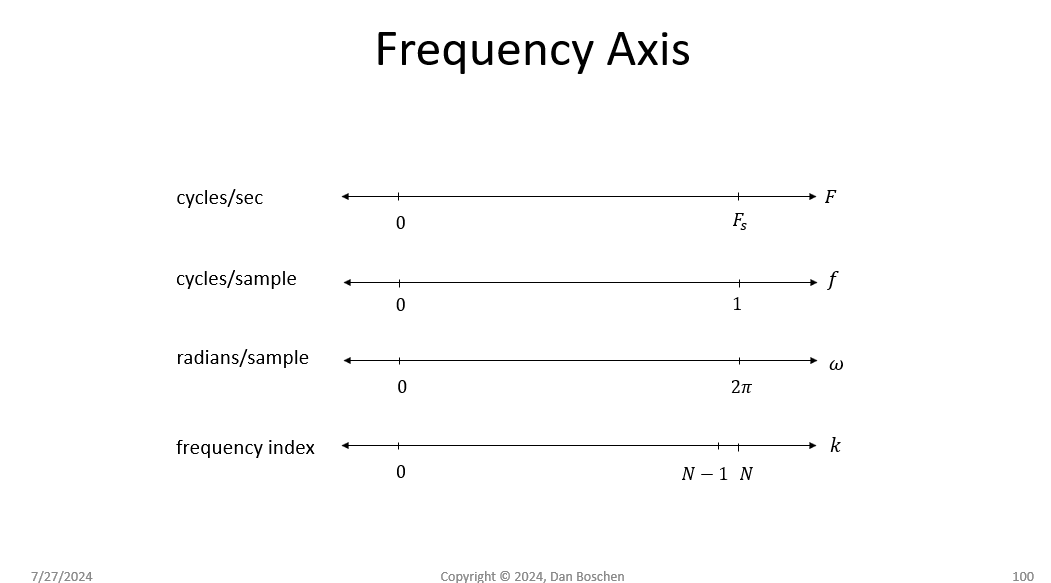
Below is a summary of the most common units used for representing the frequency domain. This is to show all the different units side by side, but keep in mind the units in this question have to do with the vertical axis, not a horizontal axis (such as dB/Hz which is dB/(cycles/sec) converted to dB/(radians/sample). The units on the two axis are independent for a power spectral density, but it would be typical and convenient to use the same units for each (as an example depicting at a 10 KHz center frequency, the power spectral density is -30 dBm/Hz which is 1 uW/Hz). That said to describe what I depict below:

The top one is cycles/sec or Hz. If we scale that by the sampling rate, we get normalized frequency in cycles/sample. Notice how we have simply used a time index of samples instead of seconds. Also observe how the inverse of the sampling rate in Hz is seconds/sample (how much time for each sample). Thus if we divide Hz by the sampling rate we get (cycles/sec)/(sec/sample) which is cycles/sample. We convert frequency in Hz to radian frequency by multiplying by $2\pi$ so similarly we can multiply normalized frequency in cycles/sample by $2\pi$ to get normalized frequency in radians/sample. Finally, as commonly used with the DFT, we can have a frequency index on $N$ samples typically abbreviated as $k$ with an index from $0$ to $N-1$. $N$ in this case would correspond to the sampling rate.

frequency axis

Like what you see? This plot and similar explanations are part of my DSP courses where I try to bring intuition together with the math involved for a deeper and more creative understanding of signal processing concepts. You can find the latest course listings at https://dsprelated.com/courses and https://ieeeboston.org/courses/ Course registration is open now for courses starting very soon!

$\endgroup$
5
  • $\begingroup$ Thanks for the reply. What I am more confused about is that it is not the frequency axis, but the y-axis that is scaled by 2*pi/Fs. Why is that done? $\endgroup$
    – ShiS
    Commented Jul 28 at 1:25
  • 1
    $\begingroup$ Because the y-axis has frequency in it. It is a density which means power per unit bandwidth. So in one case its power per Hz which is power per (cycles/sec) and in the other case its power per (radians/sample). Make sense? $\endgroup$ Commented Jul 28 at 1:37
  • 1
    $\begingroup$ power densities can be a little confusing since we have units of frequency along the x-axis as well. What this means is if you went to a specific frequency on the x-axis, the y-axis value at that point is the amount of power per unit bandwidth at that location. So for example imagine I had a waveform that occupied 100 Hz of BW at 10 KHz. I would review the PSD and from that determine what the density is at 10 KHz as S(f) and in units of W/Hz - consider if it was 0.1W / Hz, and assuming it was relatively flat I could then determine the total power as 100 Hz x 0.1W/Hz = 10W total. $\endgroup$ Commented Jul 28 at 1:41
  • 1
    $\begingroup$ (I showed the frequency axis as it was a graphic I had that put all the common units of "Frequency" side by side - not to imply that it is the frequency axis changing in the case of a PSD. If you think that may confuse future readers, i can delete that graphic - let me know) $\endgroup$ Commented Jul 28 at 1:42
  • 1
    $\begingroup$ The graphic as well as whole explanation is very informative, thanks (i could not find such an elaborate explanation in any book). Have another related doubt, would put that up as a separate question, thanks!! $\endgroup$
    – ShiS
    Commented Jul 28 at 3:54

Your Answer

By clicking “Post Your Answer”, you agree to our terms of service and acknowledge you have read our privacy policy.

Not the answer you're looking for? Browse other questions tagged or ask your own question.