how do i conclude a waveform shows doppler tolerance, say polyphase code-frank code, without the use of ambiguity diagram? we know that it is doppler tolerant and if we check the frequency spectrum of output of matched filtering, it will show the shift right? so how do i differentiate it from 13bit barker code? i'm trying to implement this on matlab, but, i need to get my theory right first.
-
1$\begingroup$ Why do you not want to use an ambiguity diagram? That is the easiest way to determine doppler tolerance. $\endgroup$– BaddioesCommented Jan 15 at 23:08
-
$\begingroup$ @Ian I think there is more here for me to understand with regards to Frank codes and related Doppler tolerance so I deleted my answer to attract other better ones. $\endgroup$– Dan BoschenCommented Jan 15 at 23:28
-
$\begingroup$ I second @Baddioes question. Are you trying to avoid using a built-in function to produce the ambiguity diagram? Or is there something about the theory that maybe needs more explanation before you use one for analysis in general? $\endgroup$– EnvidiaCommented Jan 16 at 16:01
3 Answers
You should really read this paper, Phase Coded Waveforms for Radar, on doppler tolerance and phase coded waveforms.
I'll summarize section 5 on doppler intolerance for phase coded waveforms. PC waveforms are broken up into "chips", where each chip is the original signal with a phase offset. Each chip has a separate phase offset from the previous chip. It could be the same, it could be different.
Frequency is the derivative of phase. So, if you have a target at a constant radial velocity inducing a doppler shift $f_{d}$, a linear phase shift across your pulse will be induced. For short pulse widths, it's likely a good enough approximation that the phase will be linear even if there is some non-zero acceleration.
For an uncompressed phase coded pulse, the phase shift experienced by each chip is
\begin{equation} \phi_{n} = 2\pi \frac{nf_{d}\tau}{N-1} \end{equation}
where $N$ is the number of chips, $\tau$ is the pulse width, and $n \in [0,N-1]$.
If you want to figure out doppler tolerance for phase coded waveforms, and not use an ambiguity function, you can compare the output of the matched filter with an input signal not affected by doppler shift with the output of the matched filter where the signal has suffered a doppler shift. You can use, for example, a $3 \, dB$ criteria to determine at what doppler shift is there too much degradation to be considered doppler tolerant. Usually, doppler tolerance is defined for a range of doppler frequencies.
A way of compensating for doppler with phase coded waveforms is to design a "mismatched" filterbank. Mismatched filters compensate for the doppler shift by applying a linear phase across each chip. This is also discussed in section 5 of the paper. You can attempt to get a good pulse compression by compensating for the doppler shift in the matched filter coefficients.
-
$\begingroup$ To compensate you want to separate the returns by angle/Doppler prior to removing the waveform. If the same waveform is repeated on each pulse, this can be achieved by a simple keystoning of the data. If the waveform changes from one pulse to another, things get more complicated but it is doable. Using a bank of filters that are offset in frequency from one another just introduces redundancy into your output, which then has to be dealt with using detection or some other non-linear process. $\endgroup$ Commented Jan 24 at 18:54
The ambiguity diagram is used to analyze the result of pulse compression when receiving a Doppler-shifted version of the original waveform. I am not sure why you want to avoid the ambiguity diagram itself. The ambiguity function for a waveform $s(t)$ is given by:
$$A(\tau, f_D) = \int_{-\infty}^{\infty}s(t)e^{j2\pi f_Dt}s^*(t-\tau)dt$$
When you are looking at the output of a nominal matched filter, you're really looking at the zero-Doppler slice. If you consider $f_D=0$ then
$$A(\tau, 0) = R(\tau) = \int_{-\infty}^{\infty}s(t)s^*(t-\tau)dt$$
Which is exactly the autocorrelation function of $s(t)$, which is what the matched filter nominally yields. By analyzing the output of the matched filter, you're looking at a single slice of the ambiguity diagram. Repeating the operation for all considered Doppler frequencies $f_D$ allows you to build the full ambiguity diagram. The diagram will then show you what the output of the nominal matched filter looks like when the return signal has a Doppler shift. There are other aspects of the waveform that can be analyzed, such as range and Doppler resolution, but we won't go over that here.
Doppler Tolerance
There are multiple metrics that define "Doppler tolerance", and are dependent on what is important for a specific application. These include:
- SNR loss (or loss in the peak output)
- Side-lobe levels
- Other characteristics such as any time-shifts (e.g., when considering the LFM waveform)
As you already know, some classes of waveforms are more Doppler tolerant than others. In other words, some waveforms deviate less from the nominal matched filter response when a Doppler shift is induced.
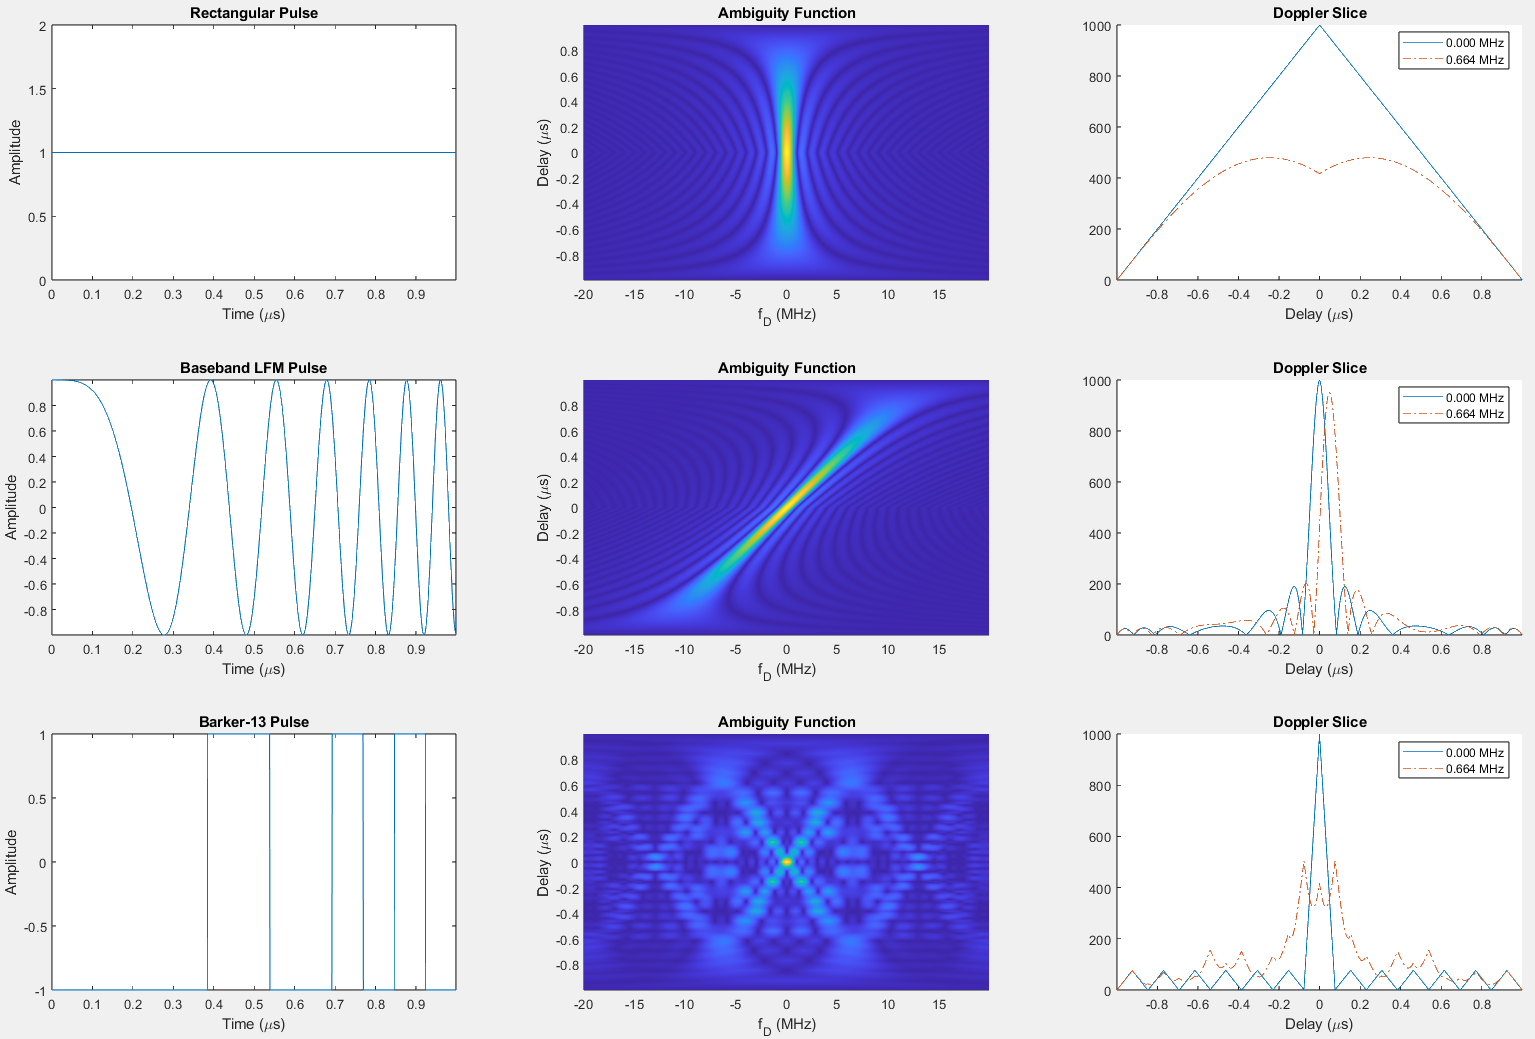
Let's consider three pulse types: rectangular (aka unmodulated), linear frequency modulated (LFM), and Barker-13 (phase modulated). From worst to best, their Doppler tolerances could be ranked as
- Barker-13
- Rectangular
- LFM
The following example uses the same pulse width for all pulse types. The LFM and Barker-13 have the same bandwidth, which is greater than the rectangular pulse, hence why the responses are sharper.
The plot shows the nominal baseband pulse, the ambiguity function, and the matched-filter output which is taken from the zero-Doppler slice and a slice taken at a Doppler of 664 kHz (which is aggressive).
In the case of the Barker-13, not only is the peak response much lower, but the overall structure of the output is destroyed. Similarly with the rectangular pulse, but depending on your needs, is not "as bad". The LFM waveform however maintains a higher peak when compared to the nominal output, and the sidelobe structure is better maintained. It does however shift in time, which is known as range-Doppler coupling, but can be easily corrected.
Relative to the other pulses, we say that the Barker-13 is Doppler intolerant, and conversely that the LFM pulse is Doppler tolerant. You will read in literature that phase-coded waveforms are intolerant, and that is due to the discontinuities inherent to their phase modulation, which wreaks havoc once a Doppler-shift is induced. Additional techniques must be employed to compensate, such as a series of matched-filter banks that have been matched to the nominal waveform and a particular set of Doppler frequencies.
-
$\begingroup$ i wanted to get my theory right, thus was avoiding ambiguity diagram $\endgroup$– user70596Commented Jan 20 at 5:27
-
$\begingroup$ @ian If you're comfortable with the matched filter, then extending to the ambiguity diagram is a simple step. You just repeat applying the matched filter, but shift the input waveform by a Doppler shift to fill each column. $\endgroup$– EnvidiaCommented Jan 20 at 6:34
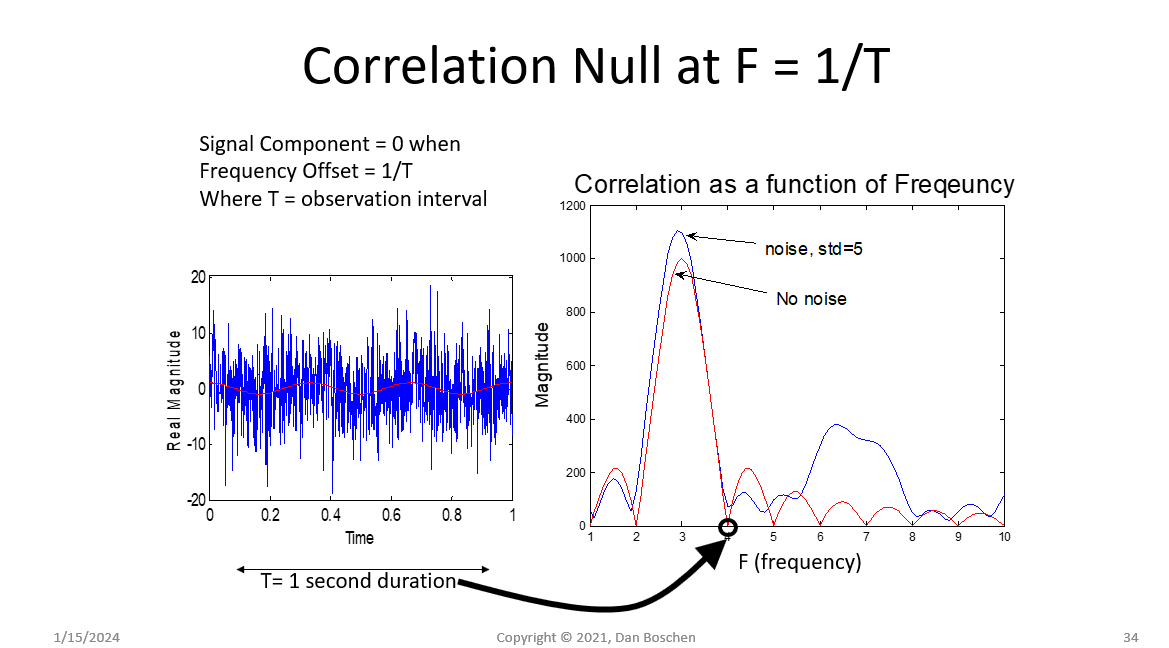
To add together with the other answers provided for further intuition, note that correlation as a function of frequency generally follows a Sinc shape with the first null at $1/T$ where $T$ is the duration of the matched filter. This applies when the underlying waveform is constant over the duration of the correlation interval. The graphic below is one I have demonstrating correlating to a 3 Hz tone ($e^{j2\pi 3 t}$) buried in noise over a 1 second time duration, but we can see from the other posts that this result of correlation magnitude decreasing versus frequency offset would apply to the other waveforms shown.
This is corresponding to the magnitude at the correlator output at 0 delay offset, and Doppler offset alone. For example with Envidia's example, T= 1 us and Doppler offset = 0.664 MHz. The Sinc shape would have it's first null at 1/1us = 1 MHz, and at .664 MHz the scaling would be given by $sinc(T f_{dopp}) = sinc(0.664) = 0.417$. Observe that this is the magnitude at Delay = 0 for all three of Envidia's results.
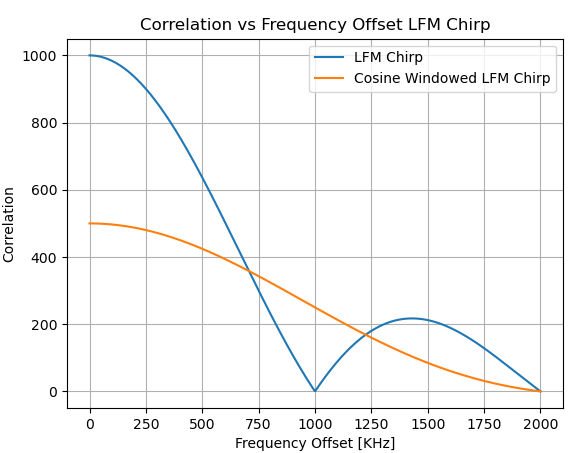
This is also consistent with all waveforms being constant envelope and thus this correlation result is the Fourier Transform of a rectangular window (as a Sinc), which also has the tightest frequency resolution. Windowing any of these waveforms would decrease the sensitivity to Doppler at the expense of SNR at the correlator output as demonstrated below using Envidia's Chirp example:
The blue trace shows how the magnitude out of the correlator decreases versus Doppler frequency offset for the LFM Chirp as given (and we further confirm here that at 664 KHz the magnitude is 417/1000 = 0.417 as predicted). The orange trace shows the same result if the LFM Chirp was first multiplied with a simple cosine window. The overall magnitude is decreased (SNR penalty) but the sensitivity to Doppler is also significantly reduced. Reducing the total time duration (as first introduced) would also decrease the Doppler sensitivity as well as decrease SNR, and this typically would be the better option when reduced Doppler sensitivity is required for any waveform.
-
$\begingroup$ hey! so the spectrum of output of matched filter does show a shift in frequency right? peak at f_doppler=1kHz for v=50, wavelength=0.1 for a frank code? or is the peak supposed to be at 0Hz because its doppler tolerant? $\endgroup$– user70596Commented Jan 15 at 17:35
-
$\begingroup$ Assuming a particular result with 0 offset, the spectrum of the resulting signal at the matched filter output after the input signal changes by delta f will have changed by delta f. What this graph I present shows is how the signal level will decrease due to frequency offset, assuming we are doing a correlation operation in the matched filter over time duration T. $\endgroup$ Commented Jan 15 at 21:42


