I want to simulate a Pulse Doppler Radar with medium pulse repetition frequency (PRF about $100\textrm{ kHz}$, about $500$ pulses in pulse train).
It's rather powerful, and should discriminate targets with $1\textrm{ m}^2$ RCS in ranges up to $200\textrm{ km}$. Okay, let's build its range-speed image (about $\pm 750\textrm{ m/s}$ in speed dimension, about $1500\textrm{ m}$ in range).
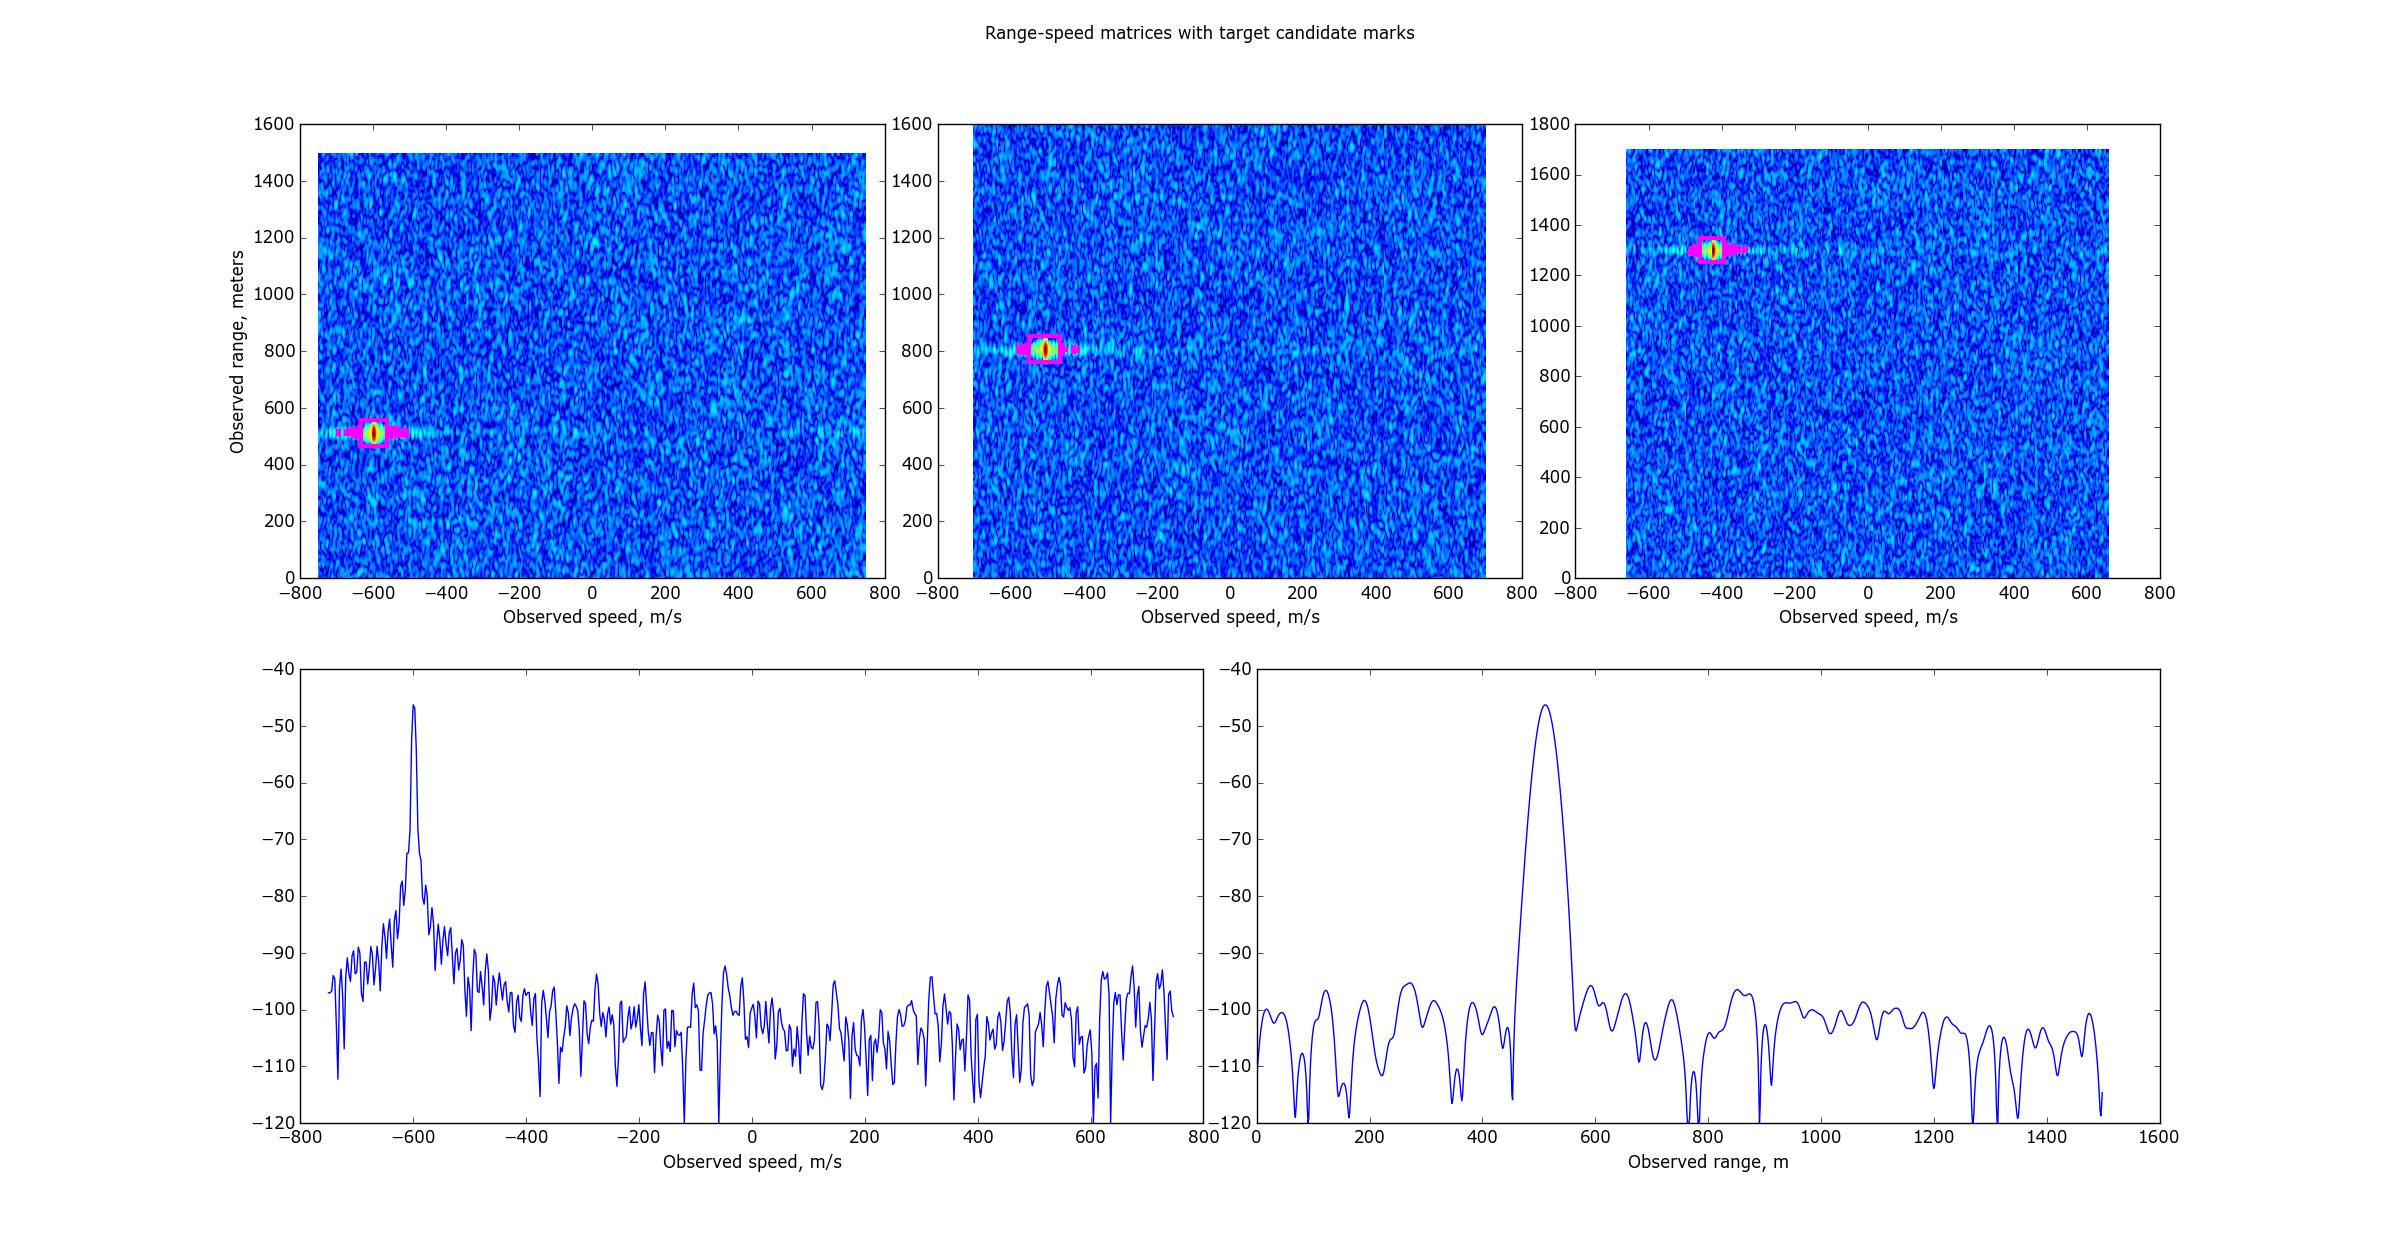
But there is a problem: when there are some targets nearby (about $10\textrm{ km}$) they give not just a peak that can exceed the discrimination threshold, but a cross-like figure (sidelobes in range dimension, end, especially, sidelobes in speed dimension). And if the target is close enough, freaky sidelobes still can exceed the threshold and be treated as target candidates.
Even if I use window function with heaviest sidelobe-cancelling effect (Blackman-Harris), the sidelobes became smaller bus weren't wided out completely (and still give me ghost targets).
I think that I missed some important step in Range-Doppler matrix processing. Maybe some additional filtering. Cannot you tell me, what shoud I do to get rid of the sidelobes?
Here's some illustration: on the top row there are Range-Doppler matrices for different PRF ratios, and on the bottom row there is the range-speed matrix slice by speed (left) and range(right) in the target peak. The speed dimension annoyes me most = )
P.S. The number of DFT bins: 540 by speed, about 1200 by range (1200, 1280 and 1360, because PRFs varies).
About the size of the sidelobes -- I don't know how to add the colorbar to such a multi-plot figure, but I've added two additional plots to the bottom. In the left-bottom corner there is the signal power with different speeds (with the fixed range of the max peak range) and in the right-bottom corner there is the signal power with different ranges (with the fixed speed of the max peak speed). The units are power dB.

