I am working with Zadoff-Chu sequences in a Python simulation of an LTE-like communication system and need to understand the effects of carrier frequency offset (CFO) on these sequences. Specifically, I'm looking to derive an analytical expression for the cross-correlation between the original IDFT transformed Zadoff-Chu sequence and its version with applied CFO. The goal is to estimate the Peak of the correlation according to the CFO and to find out at which cfo the correlation receiver will fail. With the simulation i already figured out, that the peak is shifted when the CFO is too big. I am trying to derive mathematically an expression to find a rule how big the CFO can be without getting a shifted peak.
Does anyone has any idea how to find or derive an expression?
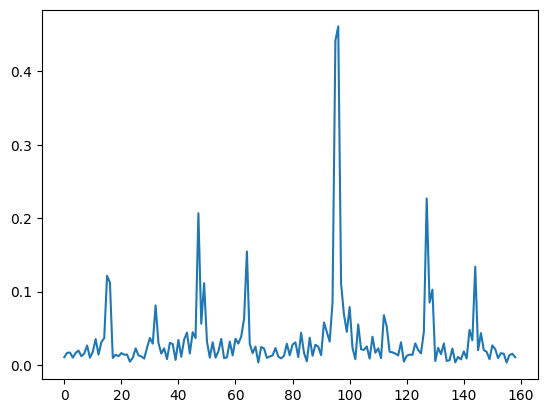
Here is a plot which shows the correlation with a cfo = 1/T (While T is the symbol time). It shows that the cfo caused a shifted peak. (Usually it is without cfo in the middle).

Here's the setup: I generate the Zadoff-Chu sequence, apply a CFO, and then transform the sequence back to the time domain using an IDFT (Inverse Discrete Fourier Transform). I need to analytically calculate the cross-correlation of the resulting sequence with the original sequence to estimate the CFO.
import numpy as np
import matplotlib.pyplot as plt

def zadoff_chu(u):
    n = np.arange(63)
    x = np.exp(-1j*np.pi*u*n*(n+1)/63)
    x[31] = 0  # This corresponds to the DC subcarrier
    return x

N = 80 # modulation similar to LTE but with N=80 instead of 2048
fs = N*15e3
carriers = slice(N//2 - 31, N//2+31+1) # OFDM carriers

symbol_time = N/fs

zc_freq = np.zeros(N, 'complex')
zc_freq[carriers] = zadoff_chu(25) # the root is one of the specified in LTE (25,29,34)
zc_time = np.fft.fftshift(np.fft.ifft(zc_freq))

cfo = 1/symbol_time #example cfo
zc_time_cfo = zc_time*np.exp(1j*2*np.pi*critical_cfo*np.arange(N)/fs)

corr = np.correlate(zc_time_cfo, zc_time, 'full')
plt.plot(np.abs(corr)) # with the current cfo the peak is shifted and not at N//2
