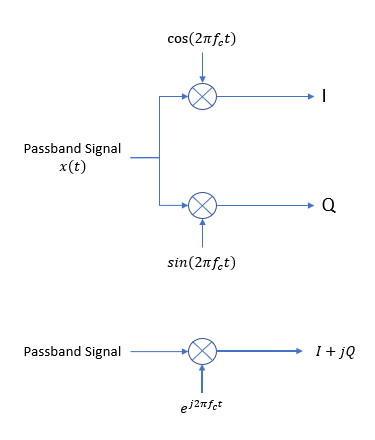
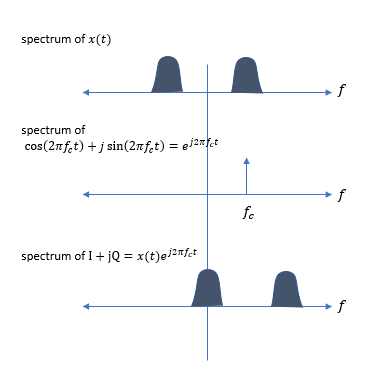
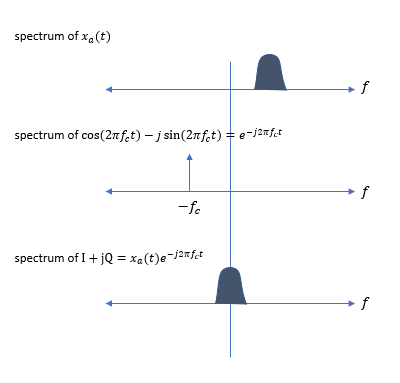
I'm want to generate the IQ components of a FSK signal using numpy and then try to demodulate the resulting IQ samples by looking at the derivative of its phase in time.
This is the script I have:
import numpy as np
import matplotlib.pyplot as plt
from scipy import signal

fs = int(1.8e6) # Hz
rb = int(1e3) # bps

message = b"AAAABBBBCCCCDDDD"

f_one = 30e3
f_zero = 10e3
fc = (f_one + f_zero) / 2

t = np.arange(0, 0.2, 1 / fs)
x = np.zeros(np.size(t))

start_t = 0.05
start_i = int(fs * start_t)
samples_per_bit = fs // rb
print(f"Each bit takes: {samples_per_bit} samples, {samples_per_bit / fs * 1e3:.2f} ms")

bit_index = 0
for i in range(10):
    tempslice = slice(
        start_i + bit_index * samples_per_bit,
        start_i + (bit_index + 1) * samples_per_bit
    )
    if i % 2 == 0:
        x[tempslice] = np.cos(2*np.pi*f_one*t[tempslice])
    else:
        x[tempslice] = np.cos(2*np.pi*f_zero*t[tempslice])
    bit_index += 1

for byte in message:
    for i in range(8):
        one = (byte >> (7 - i)) & 1
        tempslice = slice(
            start_i + bit_index * samples_per_bit,
            start_i + (bit_index + 1) * samples_per_bit
        )
        if one:
            x[tempslice] = np.cos(2*np.pi*f_one*t[tempslice])
        else:
            x[tempslice] = np.cos(2*np.pi*f_zero*t[tempslice])
        bit_index += 1

plt.figure()
plt.title("Signal vs time")
plt.plot(t * 1e3, x)
plt.ylabel("Amplitude")
plt.xlabel("Time [ms]")

### Plot spectogram ###
fft_size = 256

num_rows = len(x) // fft_size
spectrogram = np.zeros((num_rows, fft_size))
for i in range(num_rows):
    w = x[i*fft_size:(i+1)*fft_size] * np.hamming(fft_size)
    spectrogram[i, :] = 20*np.log10(np.abs(np.fft.fftshift(np.fft.fft(w))))
spectrogram = spectrogram[:, fft_size//2:]

plt.figure()
plt.imshow(spectrogram[::-1,:], aspect='auto', extent = [0, fs/2/1e6, 0, len(x)/fs * 1e3])
plt.title("Original spectrogram")
plt.xlabel("Frequency [MHz]")
plt.ylabel("Time [ms]")

### IQ SAMPLING ###
I = x * np.cos(2*np.pi*fc*t)
Q = x * np.sin(2*np.pi*fc*t)
s = I + 1j * Q

plt.figure()
plt.plot(t * 1e3, np.real(s), label="I")
plt.plot(t * 1e3, np.imag(s), label="Q")
plt.title("After sampling")
plt.ylabel("Amplitude")
plt.xlabel("Time [ms]")
plt.legend()

plt.figure()
plt.plot(I, Q,'.')
plt.title("Constelation")

# Recover signal
plt.figure()
plt.plot(t, I*np.cos(2*np.pi*fc*t) + Q*np.sin(2*np.pi*fc*t))
plt.title("Signal from IQ")
plt.ylabel("Amplitude")
plt.xlabel("Time [ms]")

### FSK DEMODULATION ###
real = np.real(s[:-1]) * np.real(s[1:]) - np.imag(s[:-1]) * np.imag(s[1:])
imag = np.real(s[:-1]) * np.imag(s[1:]) - np.imag(s[:-1]) * np.real(s[1:])
phase_der = np.arctan2(imag, real)

plt.figure()
plt.plot(t[:-1] * 1e3, real, label="I")
plt.plot(t[:-1] * 1e3, imag, label="Q")
plt.title("After demodulation")
plt.ylabel("Amplitude")
plt.xlabel("Time [ms]")
plt.legend()

plt.figure()
plt.plot(t[:-1] * 1e3, np.sign(phase_der))
plt.title("Phase derivative")
plt.ylabel("Amplitude")
plt.xlabel("Time [ms]")
plt.show()
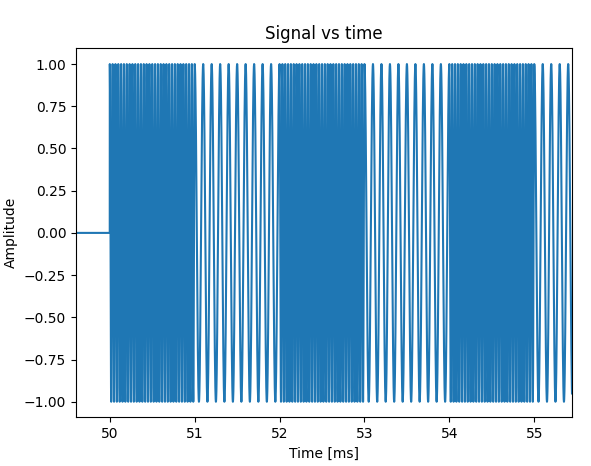
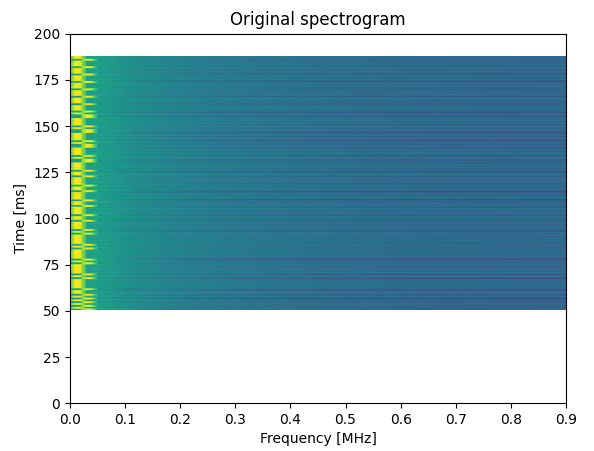
This is a closeup on the time signal I generate from the bitstream and its spectrogram. As you can see I chose very low frequencies for FSK so that I can see easily the effect of this modulation:
Then I try to get the IQ samples and convert it to complex numbers by:
I = x * np.cos(2*np.pi*fc*t)
Q = x * np.sin(2*np.pi*fc*t)
s = I + 1j * Q
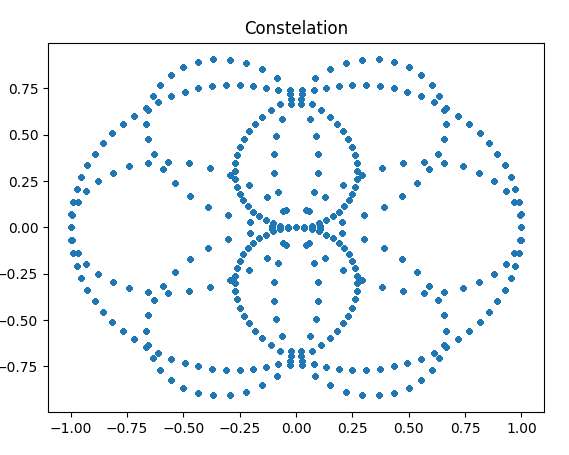
From this I plot the constellation diagram. This is the part I don't understand. I was expecting the constellation to show a perfect circle of unit radius, but this is what I get:
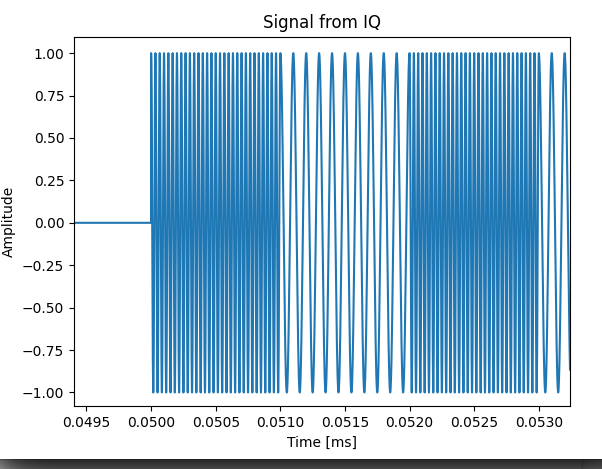
Can anyone shine a light here? I reckon this has something to do with the way I calculate the IQ components, but I can't figure out what would be the correct way to do it. I also tried to recover the time signal from the IQ samples and I get exactly the same signal, so I don't know:

