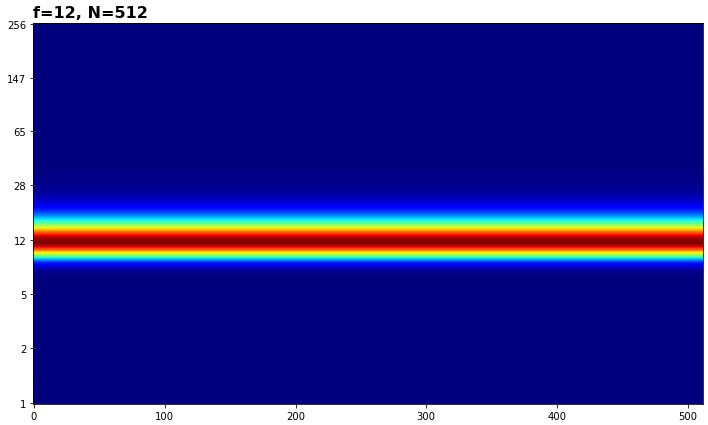
I am following the ssqueezepy simple example.
The plot should show f=12 but it shows around 33.

- Is this a bug or have I scaled the y-axis wrong?
- Also the plot is not a straight plot as it waves at the right end, close to 500.
import numpy as np
from ssqueezepy.visuals import imshow
from ssqueezepy import cwt

def _t(min, max, N):
    return np.linspace(min, max, N, False)

def cos_f(freqs, N=128, phi=0):
    return np.concatenate([np.cos(2 * np.pi * f * (_t(i, i + 1, N) + phi))
                           for i, f in enumerate(freqs)])

wavelet = ('morlet', {'mu': 5})
f, N = 12, 512

x = cos_f([f], N=N)
Wx, scales, *_ = cwt(x, wavelet,fs=N)

imshow(Wx, abs=1, yticks=scales, title="f=%d, N=%d" % (f, N), show=1,
       cmap='jet')

