I'm building a Continuous-Phase BFSK Transmitter using Python and PlutoSDR.
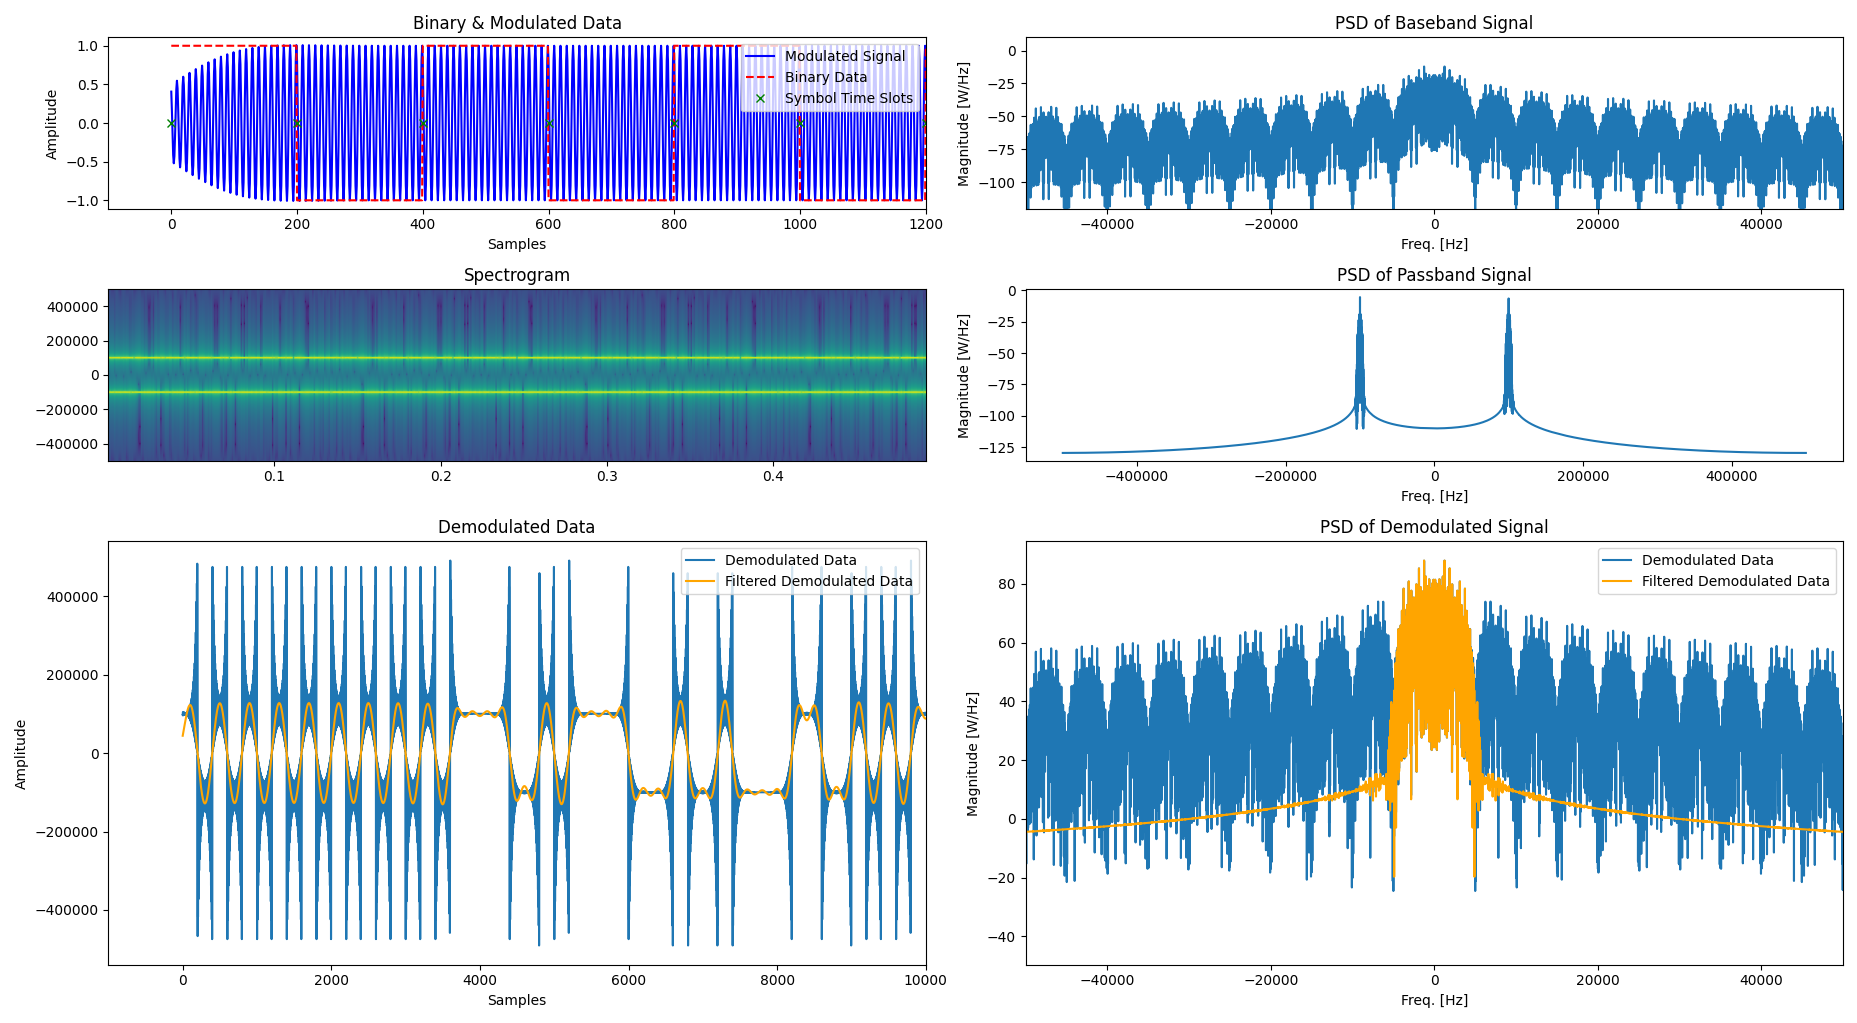
Something that I don't understand is the spectrum of the up-sampled baseband signal - the digital 0's and 1's over-sampled by the Sample per Symbol (fs/sr = 1000KHz/5KHz = 200) ratio:
 The graphs describe the signal in time and frequency, baseband, modulated and demodulated, now the thing I don't understand is the upper right plot, the "PSD of Baseband Signal" graph, why there are what seems to be duplications of the main lobe? all of them span over a 5KHz BW (Symbol rate = 5KHz, fs = 100KHz).
all of them together are the baseband signal? I'd think the signal is just the main lobe in the middle.
The other graphs show the signal in the time domain (upper left plot), spectrogram, signal after CP-BFSK modulation, Demodulated data (using Quadrature demodulation) and filtered Demodulated Data in time, and their spectrums.
adding the python code for reference:
from binascii import crc32
import sys
from matplotlib import gridspec
sys.path.append(r"C:\Users\User\Desktop\Python_Scripts\PlutoSDR")
import mySDRlib as sdr
import numpy as np
import matplotlib.pyplot as plt
from matplotlib.gridspec import GridSpec

def cp_bfsk_mod(bin_data,fs,sr,f0,f1,cp_flag=1):
    samples_per_symbol = int(fs/sr)
    num_of_samples = len(bin_data)*samples_per_symbol
    samples_array = np.arange(num_of_samples)
    bits_as_freqs = [f0 if b==0 else f1 for b in bin_data]
    upsampled_bits_as_freqs = np.repeat(bits_as_freqs,samples_per_symbol)

    if cp_flag:
        arg = np.cumsum(2*np.pi*upsampled_bits_as_freqs/fs)
    else:
        arg = 2*np.pi*upsampled_bits_as_freqs*samples_array/fs

    modulated_bfsk_data = np.exp(1j*arg)
    return modulated_bfsk_data

def apply_protocol(bin_data):
    preamble = [1,0]*8 # 16
    start_flag = [1,0,1,1,1,1,0,0,1,0,1,1,1,1,0,0] # 0xBCBC # 16
    byte_data = bytes(bin_data)
    crc = crc32(byte_data)
    crc_bin = sdr.int2bin(crc,32)
    crc_bin_list = [int(bit) for bit in list(crc_bin)] # 32
    whole_message = preamble+start_flag+bin_data+crc_bin_list
    return whole_message


# Globals
PLOTS = 1
TX = 0
PULSE_SHAPING = 1
REPEAT_TX = 10
NFFT = 1024
WINDOWS_FUNC = sdr.firdes.WIN_BLACKMAN_HARRIS


# Constants
fs = 1000e3
sr = 5e3
sps = int(fs/sr)
f0 = -100e3
f1 = -f0

# Data
ascii_data = "Hello World!"*25
bin_data = sdr.ascii2bin(ascii_data)
protocol_data = apply_protocol(bin_data)
bin_data = protocol_data

# Modulated Data
sampled_bin_data = np.repeat([2*b-1 for b in bin_data],sps)
modulated_binary_data = cp_bfsk_mod(bin_data,fs,sr,f0,f1,1)
symbol_time_vec = np.arange(0,len(modulated_binary_data),sps)

# Transmitter Filter
low_cutoff = 97.5e3
high_cutoff = 102.5e3
transition_bw = 5e3
filter_gain = 1

# Transmitter
fcRx=1433e6
rx_gain_dB=30
tx_gain_dB=-50
# fcTx=434e6
fcTx=915e6

if TX:
    pluto_sdr = sdr.pluto_init(fs,buff_size=1,fcRx=fcRx,rx_gain_dB=rx_gain_dB,fcTx=fcTx)
    # sdr.pluto_tx_x_sec(pluto_sdr,modulated_binary_data,fs,fcTx,-80,3)
    pluto_sdr.sample_rate = int(fs)
    pluto_sdr.tx_rf_bandwidth = int(fs)
    pluto_sdr.tx_lo = int(fcTx)
    pluto_sdr.tx_hardwaregain_chan0 = tx_gain_dB
    if PULSE_SHAPING:
        samples_to_tx = sdr.apply_bandpass_filter(modulated_binary_data,fs,low_cutoff,\
            high_cutoff,transition_bw,filter_gain,"real",WINDOWS_FUNC)
    else:
        samples_to_tx = modulated_binary_data
    samples_to_tx *= 2**14

    print(f'Transmitting...')
    for i in range(REPEAT_TX):
        pluto_sdr.tx(samples_to_tx)
    print(f'Finished Transmitting.')

if PLOTS:
    # Testing Demodulation
    fvec = np.linspace(-fs//2,fs//2,len(modulated_binary_data))
    modulated_binary_data = sdr.apply_bandpass_filter(modulated_binary_data,fs,low_cutoff,\
        high_cutoff,transition_bw,filter_gain,"real",WINDOWS_FUNC)
    demodulated_data = sdr.quadrature_demod(modulated_binary_data,fs)

    fig1 = plt.figure('BFSK FIR BPF Modulated Data')
    r,c = 4,2
    grid = GridSpec(nrows=r,ncols=c)
    ax0 = fig1.add_subplot(grid[0,0])
    ax1 = fig1.add_subplot(grid[0,1])
    ax2 = fig1.add_subplot(grid[1,0])
    ax3 = fig1.add_subplot(grid[1,1])
    ax4 = fig1.add_subplot(grid[2:4,0])
    ax5 = fig1.add_subplot(grid[2:4,1])

    ax0.plot(modulated_binary_data.real,'b')
    ax0.plot(sampled_bin_data,'--r')
    ax0.plot(symbol_time_vec,np.zeros(len(symbol_time_vec)),'gx')
    ax0.set_xlabel('Samples')
    ax0.set_ylabel('Amplitude')
    ax0.set_title('Binary & Modulated Data')
    ax0.set_xlim([-1e2,1.2e3])
    ax0.legend(['Modulated Signal',"Binary Data",'Symbol Time Slots'],loc="upper right")

    # ax1.plot(fvec,sdr.PSD(sampled_bin_data,len(sampled_bin_data),True))
    ax1.plot(np.linspace(-fs//2,fs//2,len(sampled_bin_data)),sdr.PSD(sampled_bin_data,len(sampled_bin_data),True))
    ax1.set_xlabel('Freq. [Hz]')
    ax1.set_ylabel('Magnitude [W/Hz]')
    ax1.set_title('PSD of Baseband Signal')
    ax1.set_xlim([-50e3,50e3])
    ax1.set_ylim([-120,10])

    ax2.specgram(modulated_binary_data,NFFT=NFFT,Fs=fs)
    ax2.set_title('Spectrogram')

    ax3.plot(fvec,sdr.PSD(modulated_binary_data,len(modulated_binary_data),True))
    ax3.set_xlabel('Freq. [Hz]')
    ax3.set_ylabel('Magnitude [W/Hz]')
    ax3.set_title('PSD of Passband Signal')

    filtered_demodulated_data = sdr.apply_lowpass_filter(demodulated_data,fs,5e3,1e3)

    ax4.plot(demodulated_data)
    ax4.plot(filtered_demodulated_data,'orange')
    ax4.set_xlabel('Samples')
    ax4.set_ylabel('Amplitude')
    ax4.set_title('Demodulated Data')
    ax4.legend(['Demodulated Data','Filtered Demodulated Data'],loc="upper right")
    ax4.set_xlim([-1e3,10e3])

    fvec_demod = np.linspace(-fs//2,fs//2,len(demodulated_data))
    ax5.plot(fvec_demod,sdr.PSD(demodulated_data,len(demodulated_data),True))
    ax5.plot(fvec_demod,sdr.PSD(filtered_demodulated_data,len(filtered_demodulated_data),True),'orange')
    ax5.set_xlabel('Freq. [Hz]')
    ax5.set_ylabel('Magnitude [W/Hz]')
    ax5.set_title('PSD of Demodulated Signal')
    ax5.legend(['Demodulated Data','Filtered Demodulated Data'],loc="upper right")
    ax5.set_xlim([-50e3,50e3])

    fig1.set_tight_layout(True)

    plt.show()
Thanks in advance!
