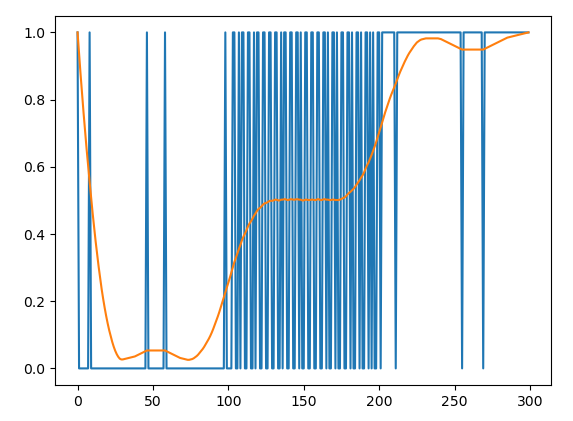
An easy and robust solution would be to low pass filter with a post-processed "Zero-phase" filter, the result of this will be time aligned with the input waveform and provide an averaged value over an observation interval.
The OP mentioned Python tools as a preference, and this is done simply with scipy.signal.filtfilt for coefficients that can be designed using scipy.signal.firls or simply a moving average over $N$ samples by using all ones for the coefficients. filtfilt will process the signal over the filter twice, so the result if a simply moving average is done would actually be equivalent to a triangular weighted average.
Ultimately I recommend considering the bandwidth of the signal modulating the PWM, and design a least squares filter (using firls) sufficient to pass this bandwidth and then rejection reasonably beyond that. As mentioned above, the processing with filtfilt will pass the signal through this filter twice (in the forward and reverse direction, hence cancelling out the linear phase and resulting in a time aligned "zero-phase" result).
Another approach is to just subtract out the delay of a standard linear-phase FIR filter since the delay for a linear-phase FIR with $N$ coefficients is simply $(N-1)/2$ samples, but I find using filtfilt simple and straightforward for this purpose.
Below is a simple demonstration of this using a 30 sample moving average:
smooth = sig.filtfilt(np.ones(30),30, pwm)


