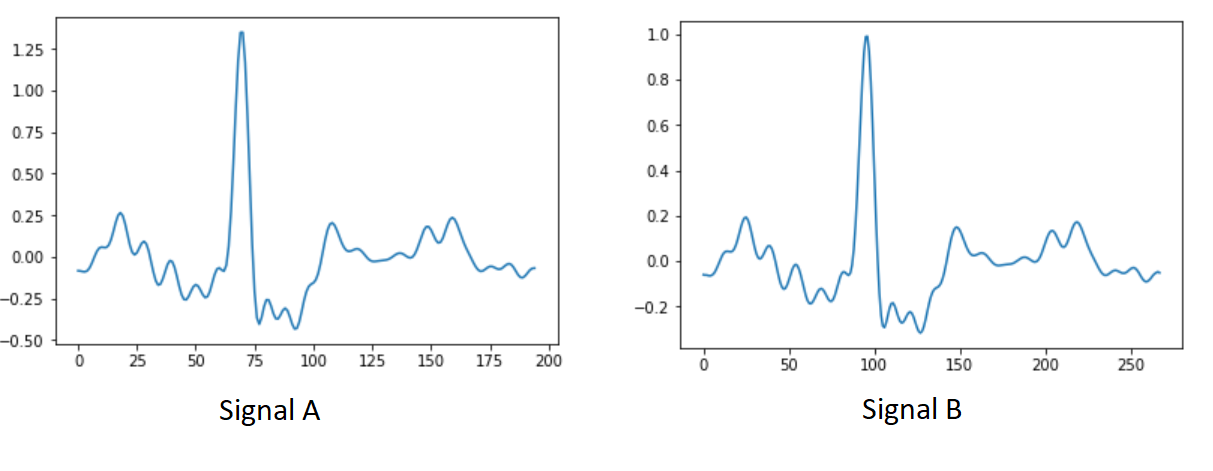
I have two signals A and B in time domain as follows:
 Visually both signals look very similar; however the X and Y axis range are different for both the signals. Signal B is basically a "stretched" version of signal A. The minimas, maximas occur at different x and y values; but relative distance between successive peaks of the signals have somewhat an uniform proportion.
I'm looking for a similarity metric that would give high similarity value for such pairs. Note dimensions of both signals are different. Due to the domain constraint, I cannot pad values to any of them. I tried cross correlation, circular correlation, and other common similarity measure but they didn't give satisfactory results.
-
3$\begingroup$ I've heard of the methodology at link below but don't know much about it. Still, it might be worth a look at. researchgate.net/publication/… $\endgroup$– mark leedsCommented May 15, 2019 at 21:18
-
$\begingroup$ If the Two signals mentioned in the above figure are discrete time signals, then please try resampling one of the signals. 1) Either downsample the second signal (with x-axis range over 250) or 2) Upsample the first signal (with x-axis range less than 200). Scaling the resampled signal by appropriate gain can help match both of them $\endgroup$– SakSathCommented May 21, 2019 at 7:17
-
$\begingroup$ Will echo the answer below and comment above that Dynamic Time Warping is a very effective technique for this task. Good packages exist in R and Python if you're looking to try it out. $\endgroup$– Byron WallCommented May 24, 2019 at 16:59
-
$\begingroup$ Can I please ask if this was resolved? $\endgroup$– A_ACommented Sep 6, 2019 at 9:00
1 Answer
You can always match the extrema via a simple linear mapping, e.g. $y[n] = \frac{x[n]-min(x[n])}{range(x[n])}$ where $range(\cdot)$ is the absolute difference between the maximum and minimum values and $x$ is the input signal. This will get $y \in [0 .. 1]$ and then you can shift that interval to whatever (min,max) and baseline you like.
The dilations in time might be a bit harder to deal with.
If you are positive that the dilations are more or less by a constant factor, then prior to assessing the similarity between the two waveforms you can resample the longer one down to the length of the shorter one and then apply correlation. In fact, you could still base your similarity only on the comparable portions of the signals spectra, either by a direct error term or via something like coherence.
But if the dilations are not stable, then Dynamic Time Warping (DTW) (as was suggested) is the better option to go for as it will give you a "speed up / slow down" vector which you can use to either map one signal on top of the other or directly, as a similarity / disimilarity metric.
Hope this helps.
