0
$\begingroup$

I'm a little fuzzy on how the Fourier transform works. It's supposed to map time domain to frequency domain, and vice versa, so my intuition says that if I wanted to make an equalizer, I'd take the FFT of the audio stream, multiply e.g. the first third of the values by 0.5, take the inverse FFT, and send that to the speakers, and I'd get audio with the base cut by half. I've attempted this sort of thing multiple times in the past ~15 years, and it never seems to work out.

Here's some test code I'm working on to mess with this: https://github.com/Erhannis/JModemTest. ATM it reads from the mic, does test processing, and plays to the speakers.
(Be aware it depends on https://github.com/Erhannis/MathNStuff, which you'll need to mvn install.)

Complications I run into:
#1, the FFT works on finite chunks of data, not on streams of data. You could just apply it over successive chunks, but then you'd get a discontinuity at the boundary, right? So your audio would have weird clicks in it.
#2, the FFT works on complex data. I vaguely understand that the complex component in the frequency domain represents phase, and that it's necessary, so I guess I'll live with it, but
#3 it seems like changing anything in the frequency domain gives you a non-zero complex component once you take the inverse FFT, and I don't think there's a physical analogue to that. (I.e., it gives you invalid data.) Is there a way to ensure your processing will yield data that gives real values once inverse-FFT'd? Or a usually-acceptable way of discarding/salvaging the imaginary component? (Like, a particular class of real-preserving processing functions, or "yeah, you can ignore the imaginary values at the end", or "use the magnitude of the complex values" (tried that, didn't seem to make a difference to the audio, shrug.))
#4 After a tiny multiplication to a few freq-domain values gave me complete static, I remembered that the FFT is kinda mirrored, so I mirrored the multiplications across the array. This gave me audio that was recognizable - but littered with glitches and chunks of static. I don't understand what mathematical process would cause that, nor how to fix it.

Long story short - how do you modify data in the frequency domain (presumably using Fourier transforms) without turning it into garbage?


Edit: AHA! In reusing some of my code for something else, I noticed that some of my byte conversions were backwards! My code works much better, now - still not great, presumably for the reasons given below, but it doesn't turn the output into garbage, and it does stuff audibly resembling the intended result! Taking all this into account, I'd say that the keys for getting not-garbage are 0. get your byte orders right, and 1. make sure your changes in the frequency domain are symmetrical after chopping off the first value.

$\endgroup$
1
  • 2
    $\begingroup$ Take a look at this en.wikipedia.org/wiki/Overlap%E2%80%93add_method. You may also benefit by brushing up a bit on the fundamental math behind the DFT and FFT. While filtering can be done they way you describe it (if you use a proper algorithm), there are lots of downsides to it and in most applications time domain filtering is by far the better solution. $\endgroup$
    – Hilmar
    Commented Sep 22, 2021 at 12:17

1 Answer 1

0
$\begingroup$

The answer has a lot to do with your point #4. The magnitude of the filter you are building by selecting some frequencies by hand has to be an even function to make sure its impulse response is real. But even if you do that, you will notice that the filtering is not good.

To show you why this happens lets build a simple example using octave/matlab. First of all, when you are selecting some frequencies and scaling them, what you are actually doing is multiplying point by point the FFT of your signal by a vector H.

Suppose:

H = [1 1 1 0 0 0 0 0 0 1 1];

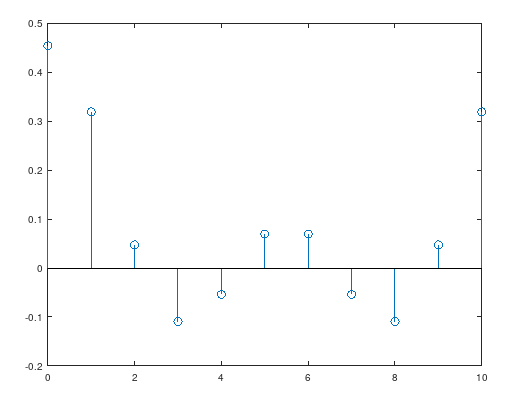
Although this may look like an ideal filter, it is not. If you take its ifft you get:

h = ifft(H); stem(0:10,h);

enter image description here

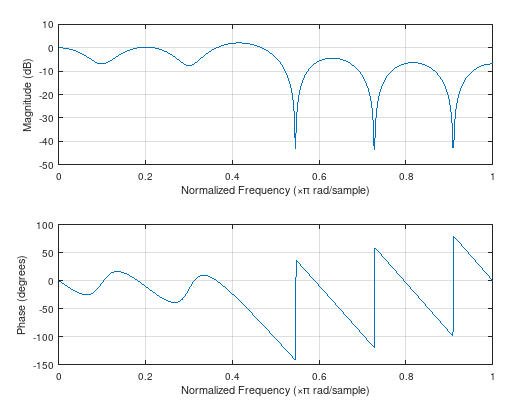
Meaning that this is actually the impulse response of the FIR filter you are using to filter your data. Moreover, lets plot its DTFT to see the actual filter frequency response:

freqz(h);

enter image description here

Notice that if you pick the exact frequencies you were scaling, they actually match your design: uniformly sampling the response will give you, in this example, a gain of 0 dB for all the points which we chose to be 1, and infinite attenuation for all the points we chose to be 0. In this case only half of the 6 zeros are shown because the plot lacks its mirrored part.

$\endgroup$
7
  • $\begingroup$ Er, hang on - H isn't even, is it? There are three 1s on the left and only two 1s on the right. In this context, "even" means you can fold the array in half and all the values match up, right? Or is H implicitly made even by copying and mirroring it, or something? $\endgroup$
    – Erhannis
    Commented Sep 22, 2021 at 15:33
  • $\begingroup$ I've confirmed that, for some reason, the first value doesn't seem to matter for evenness-preserving-realness. ...Why? $\endgroup$
    – Erhannis
    Commented Sep 22, 2021 at 15:47
  • 1
    $\begingroup$ Bare in mind that H is the DFT of h[n]. In my example h (or H) has N=11 samples. Thus, H which can be though of as the sampling of the DTFT{h[n]} from 0 to 2 pi, starting exactly at 0, will take samples with steps given by (2 pi) / N; all the way from 0 up to (2 pi) - (2 pi / 11). Hence the "last sample" which should be at 2 pi does not actually appear, but that is because of periodicity of the frequency response: this sample matches the one in 0 frequency. $\endgroup$ Commented Sep 22, 2021 at 16:05
  • $\begingroup$ Ahh, I see. I wasn't thinking in terms of 2*pi (which is cyclical, so you CAN have 0 at the left, and still be even). Moving forward - I see now that the resulting filter is one which, while it technically does what we ask, is super wonky in the ways we didn't constrain. Where does this wonkiness arise? Is it because our filter is discrete? (If I used a continuous step function instead of points, evaluating symbolically, would the weirdness go away?) Is it because of the sharp changes in the filter? (If the filter were smoother, would it act more like I expected?) $\endgroup$
    – Erhannis
    Commented Sep 22, 2021 at 16:12
  • 1
    $\begingroup$ The wonkiness comes from a bad placing of zeros and poles in the z-plane. The filter design methods basically tell you where to place them to meet your specifications. If you search for FIR or IIR digital filters design, you will find methods such as "impulse response invariance method", "trapezoidal transformation", "FIR design using windows", and many more. In practice, you generally do not need to know how to build them in detail. If you are familiar with Matlab, you can try using the "filter design tool", for instance. $\endgroup$ Commented Sep 22, 2021 at 16:48

Your Answer

By clicking “Post Your Answer”, you agree to our terms of service and acknowledge you have read our privacy policy.

Not the answer you're looking for? Browse other questions tagged or ask your own question.