0
$\begingroup$

How can I convert a time signal (audio) into the frequency domain, multiply frequency amplitudes by a vector of scalars, and convert it back into the time domain, without messing up timing information (ringing?)?

Some context:

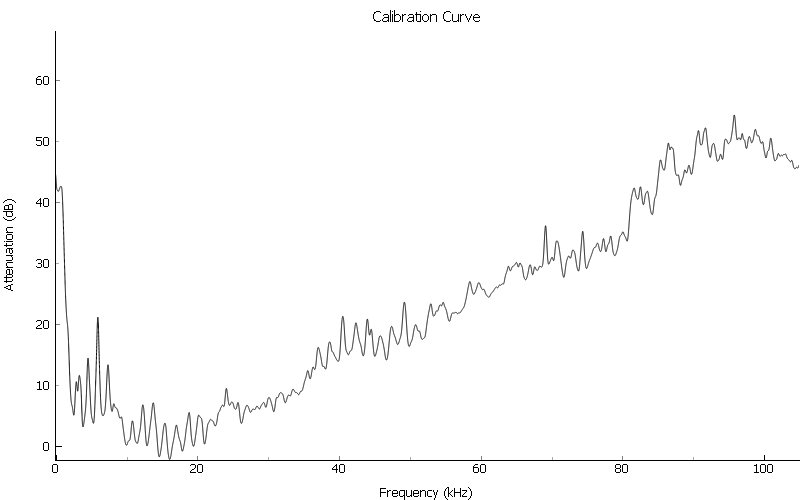
I am calibrating ultrasonic speakers. I have a frequency roll-off curve of the attenuation dB for each frequency, from a reference point. I now want to compensate my output using this curve. Here is an example that was gathered experimentally: attenuation curve
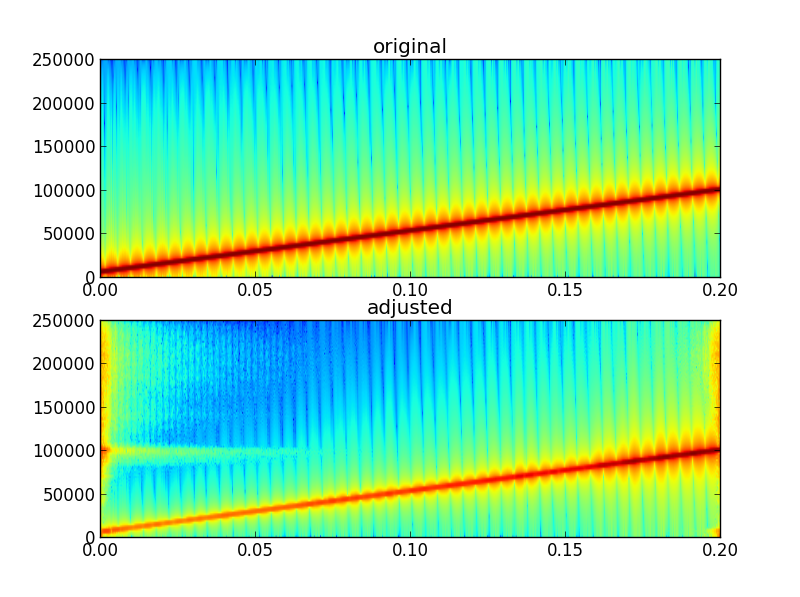
I can then multiply my output signal in the frequency domain by this attenuation vector, and convert back into the time domain. For the most part this works, however, there is some extra energy at the wrong times, and I am not sure why. Here is what it looks like: enter image description here Here is some python code to demonstrate what I have. To make this a compilable example I try to approximate the attenuation vector with a sawtooth for variation.
    import numpy as np
    from scipy.signal import chirp, sawtooth

    def smooth(x,window_len=11):
        """smooth the data using a window with requested size."""

        s=np.r_[x[window_len-1:0:-1],x,x[-1:-window_len:-1]]

        w = np.hanning(window_len)
        y=np.convolve(w/w.sum(),s,mode='valid')
        return y[window_len/2:len(y)-window_len/2]

    fs = 5e5
    duration = 0.2
    npts = duration*fs 
    t = np.arange(npts).astype(float)/fs

    # my output stimulus
    x = chirp(t, f0=5000, f1=1e5, t1=duration)

    X = np.fft.rfft(x)

    # stand-in attenuation vector
    variation = sawtooth(np.arange(npts/2 + 1)/500)
    attendB = np.linspace(0, 30, npts/2 + 1) + variation

    # attempt to minimize ringing?
    attendB = smooth(attendB)

    H = 10**((attendB).astype(float)/20)

    # signal adjusted to calibration
    A = X * H
    a = np.fft.irfft(A)

    # ==== plot ====
    import matplotlib.pyplot as plt

    plt.subplot(211)
    plt.specgram(x, Fs=fs)
    plt.title('original')
    plt.subplot(212)
    plt.specgram(a, Fs=fs)
    plt.title('adjusted')
    plt.show()

I can eliminate the extra energy by increasing the smoothing. However, this also reduces the accuracy of the calibration, as assesed by comparing the desired and recieved frequency response. Is this a trade-off I have to deal with, or am I going about this the wrong way? Alternatively, is it a feasible solution to implement this as a filter in the time domain?

$\endgroup$

2 Answers 2

2
$\begingroup$

Try zero-padding your data by a large amount (approximating the length of the impulse response associated with your frequency domain compensation), and then use a longer FFT so that circular convolution artifacts don't wrap around in time.

A smoother frequency compensation curve will usually have a shorter impulse response, thus requiring less zero-padding for a given noise floor.

$\endgroup$
3
  • $\begingroup$ How do I determine the length of the impulse response? $\endgroup$
    – hackyday
    Commented Apr 15, 2014 at 22:16
  • $\begingroup$ @hackyday: That seems like a good stand-alone question for this stack exchange. The length is infinite, but useful approximations can be shorter. $\endgroup$
    – hotpaw2
    Commented Apr 15, 2014 at 22:45
  • $\begingroup$ I thought that might be the case. Anyways, playing around with different padding lengths mitigates the artifacts to an acceptable level. $\endgroup$
    – hackyday
    Commented Apr 15, 2014 at 22:52
0
$\begingroup$

You need to make sure you window the time domain signal before FFT and after IFFT. From the diagrams, it looks like you have 'clicks' at each end of the signal, this is common when 'correcting' a system as you'll be modifying frequencies which may not be non-zero at the edges.

If you need a consistent frequency domain plot, it might be best to use the windowed overlap-add method.

$\endgroup$
2
  • $\begingroup$ In my application I use a cosine rise and fall taper on my signals. I am going to look into the over-add method, I need to do more reading, I think. Any links you would recommend for this? $\endgroup$
    – hackyday
    Commented Apr 18, 2014 at 1:02
  • $\begingroup$ A quick google search for overlap add brings hundreds of helpful pages. Im currently running 1024 point fft with 75% hann window overlap. Try experimenting with different windows and overlaps for different fft sizes. Ive managed to use 50% cosine window at 4096 point fft, and 87.5% hann^2 window at 512 point fft. $\endgroup$ Commented May 7, 2014 at 9:35

Your Answer

By clicking “Post Your Answer”, you agree to our terms of service and acknowledge you have read our privacy policy.

Not the answer you're looking for? Browse other questions tagged or ask your own question.