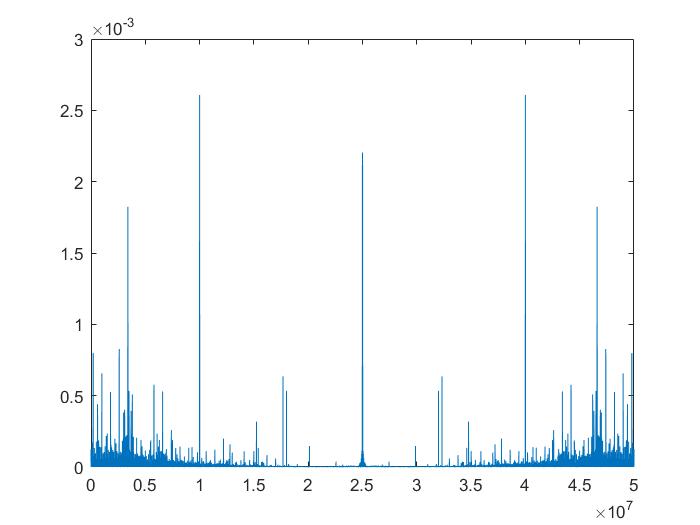
I have this code which interprets a few data points on magnetic field strength into a spectrum, as shown below:
c = fft(magfield);
c = c*2/n;
ca = abs(c);
dt = 1/fs;
f = (0:n-1)/(500*dt);

for i = 1:length(ca)
    if ca(i) > 0.002608
        ca(i) = 0;
    end
end

spectrum = fftshift(ca);
plot(spectrum)
Where fs is 5e5 and n is 50000000. what i get is a graph which looks like the one below:
I have no idea how to interpret the spectrum, where the peak frequencies are and why this mirroring effect is happening. Could you guys please shed some light on what's going on?
Thanks!

