0
$\begingroup$

Fourier series in complex form

enter image description here

Fourier series in trigonometry form

enter image description here enter image description here


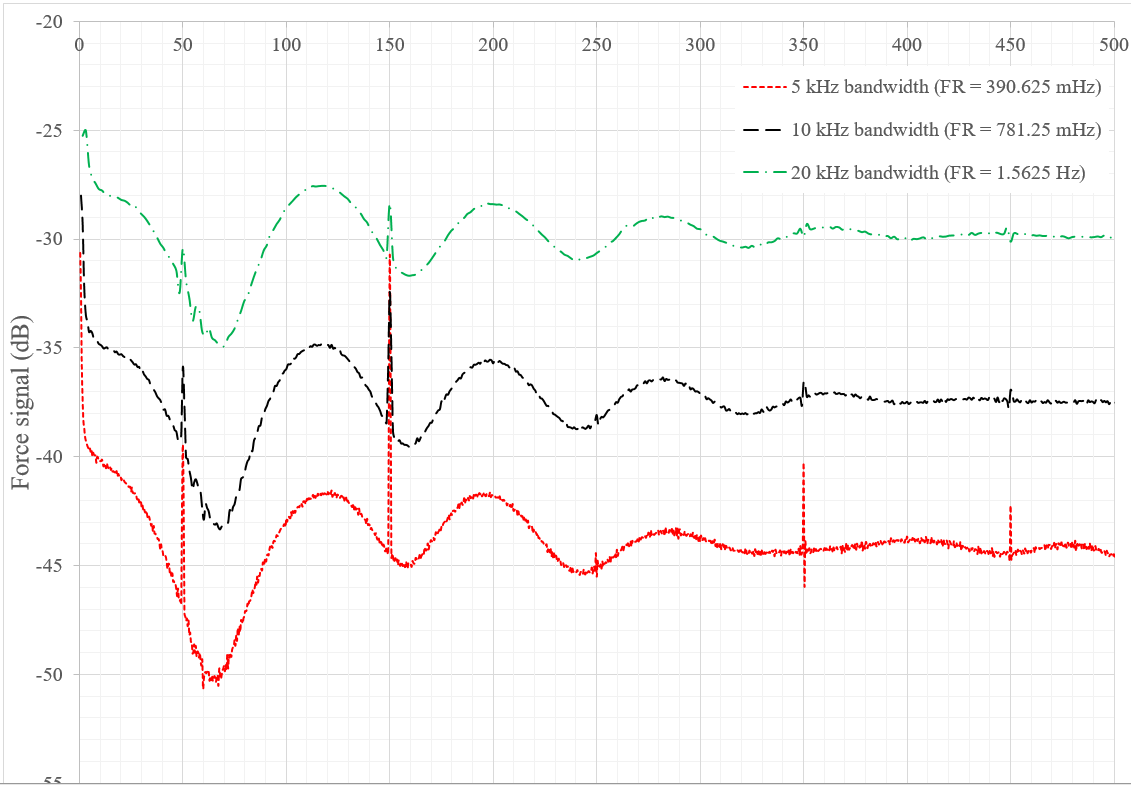
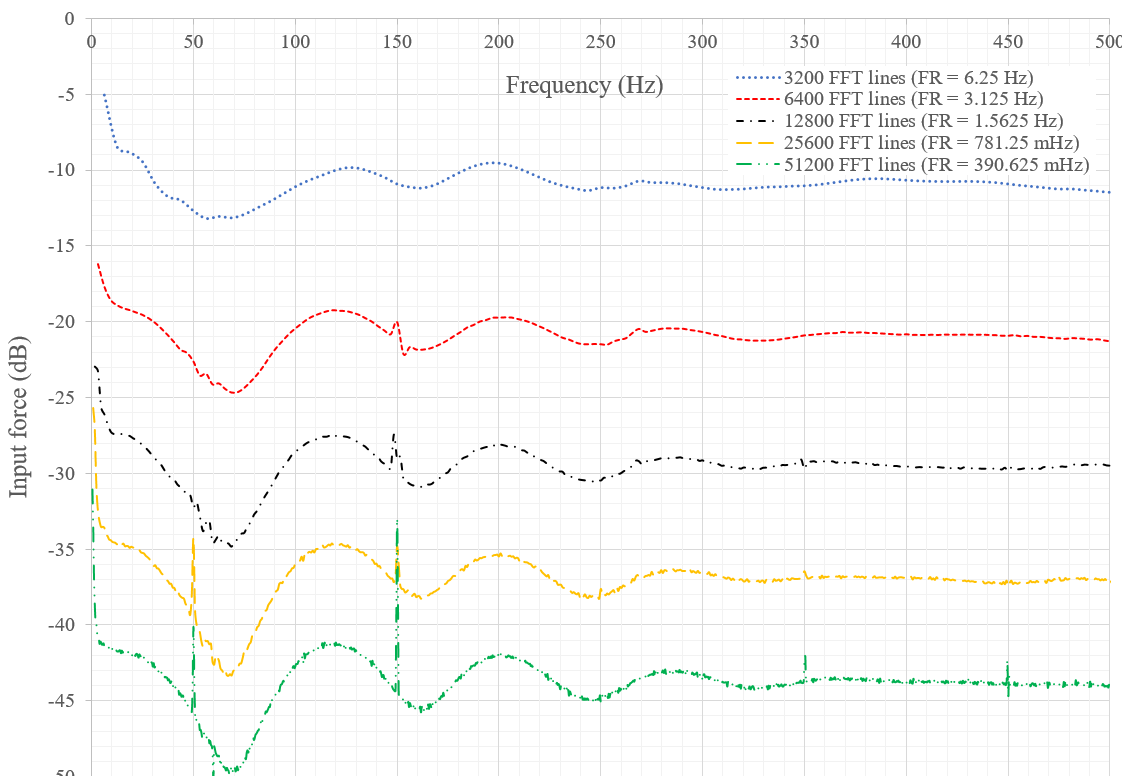
Here, I'm measuring the same signal (an impulse force - or at least as close as possible to an impulse, represented by a knocking force). The work I'm doing is parameter study (i.e.: studying the effect of different bandwidths and numbers of FFT lines).

This is on the same number of FFT lines but different bandwidth

enter image description here

And this is the same bandwidth and different FFT lines

enter image description here

The main conclusion I can draw is that changing one parameter (while keeping the other is the same) would change the amplitude of the frequency spectrum. I can explain this via math above (smaller frequency resolution leads to longer measuring time, and thus lower Fourier coefficients).

But what does it mean in a practical and realistic manner? As in for actual sampling process, how would changing the parameters (measuring time, sampling points...) affect the frequency spectrum of the same signal?

Edit: The smaller frequency resolution would eventually lead to lower amplitude in frequency spectrum is considered as analytical math by my instructor, while the actual system works with numerical math. So a more "physical" (or "what actually happens") answer is needed.

$\endgroup$

1 Answer 1

2
$\begingroup$

Are you using the correct FFT form for spectral analysis? You need to divide by N when mapping time->frequency domain with an N-point FFT for a power spectrum. If you want power spectral density you have to factor in the bin bandwidth and window effective noise bandwidths.

The amplitude of a spectral line represents the power of a single signal frequency, power spectral density reflects power per unit bandwidth, which is different.

$\endgroup$
1
  • $\begingroup$ Technically speaking, the software I use is a "blackbox" of FFT. I just have to set the parameters I need, here include the bandwidth and number of FFT lines (respectively, 1/2.56 times the sampling frequency and the number of sampled point in time domain). The graphs above are straight up FFT result of the same force signal under different conditions. $\endgroup$
    – ComradeH
    Commented Feb 5, 2021 at 18:48

Your Answer

By clicking “Post Your Answer”, you agree to our terms of service and acknowledge you have read our privacy policy.

Not the answer you're looking for? Browse other questions tagged or ask your own question.