The reason the bandpass filter eliminated the problem is because it removed the DC component. This can also be done by simply subtracting the average before taking the DFT. However there is much more to understand in this question that should be of interest to the OP, and after reading and understanding the detail given below, this first statement should make complete sense.
To be clearer, I would not refer to the effect the OP is seeing as the "sidelobes of a DC signal" but more specifically the sidelobes of the rectangular window that was used to select that portion of the DC signal in time, prior to computing the DFT. As I will explain in detail, the primary consideration is to first choose the sampling rate to be much lower such that the time duration can be increased with no penalty (for the cases when time can be arbitrarily extended such as this). A secondary consideration is improved windowing, if needed. I will detail both below.
For the benefit of the OP who is new to DSP, I will attempt to answer this as simply as possible with the basics of what is occurring. Starting with consideration of the "DC" component alone: To be truly "DC" the signal must extent to positive and negative infinity in time, as "DC" implies a constant level that never changes. The Fourier Transform of such an unrealizable signal would be the expected impulse in frequency at $F=0$, with no energy at any other frequency locations (no sidelobes). The realizable signal is both causal (starts at $t=0$) and time limited (the OP used 100 seconds). The asymmetry in time leads to a phase shift in frequency but has no other change to the magnitude of the resulting Spectrum. I will focus on the magnitude result so phase effects and causality will not be mentioned further other than that main point.
So to recap, IF the signal at DC extended to positive and minus infinity, the Fourier Transform would be an impulse in Frequency at $F=0$. However what we do in the DFT computation (in addition to sampling effects that I won't cover) is select a time limited sample of the waveform which is equivalent to multiplying the waveform in time with a "rectangular window", a function that is unity over the time interval of choice.
Multiplying two waveforms in time is equivalent to convolving those two waveforms in frequency (and vice versa). Therefore the effect of taking only a portion of the DC waveform in time with a rectangular window as has been done is equivalent to convolving the impulse at $F=0$ (as the Fourier Transform of the DC signal) with a Sinc function (as the Fourier Transform of the rectangular window!). This is the sidelobes that occur for not only the DC signal, but any other signal at any other frequency location that would otherwise be an impulse in Frequency (so the tone at 0.5 Hz will also have sidelobes all scaled by the amplitude of that tone).
That said, below shows the plot of the DFT of the rectangular window that the OP had used, using the same number of samples that were used, as well as the same result with extending the number of samples out 10 times as much (importantly this was done by "zero-padding", meaning we only increased NFFT but we did not change the actual time length of the window which is still 100 seconds).
First a wider spectrum from -1 to + 1 Hz of just the DFT of the rectangular window over the same number of samples, sampling rate and duration as the OP used (although still a narrow part of the spectrum, the signal is sampled far higher than necessary which actually leads to further processing complexity; I would recommend that the OP change the sampling rate to 10 Hz which would be more than sufficient for this!). I have superimposed a longer zero-padded DFT to show that increasing the DFT length (but not changing the time duration of the window itself!) just serves to interpolate more samples in frequency of the underlying Sinc function as the Fourier Transform of the rectangular window (and once sampled with associated aliasing effects the Sinc becomes the "Dirichlet Kernel" but at such a high sampling rate appears very much as a Sinc here):
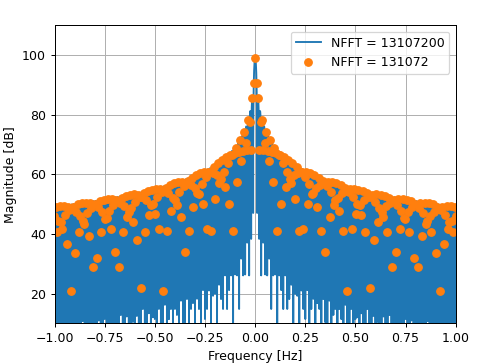
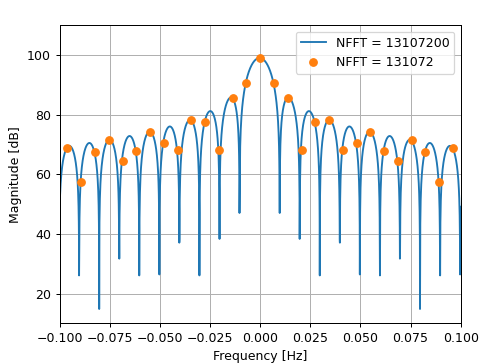
If we zoom in very close to $F=0$ we clearly see the shape of the Sinc, and how with the shorter DFT length that the OP chose results in samples on this same Sinc function (as the Fourier Transform of the Rectangular Window). We also see this very important takeaway: The first nulls for the main lobe of the Sinc appear at $f = 1/T$ where $T$ is the total time duration of the window in seconds! This is the reason that the strategy the OP should take (more important than using an improved window which also will help) is to increase the total time duration, which can readily be done with the same processing by decreasing the sampling rate (more on this later):
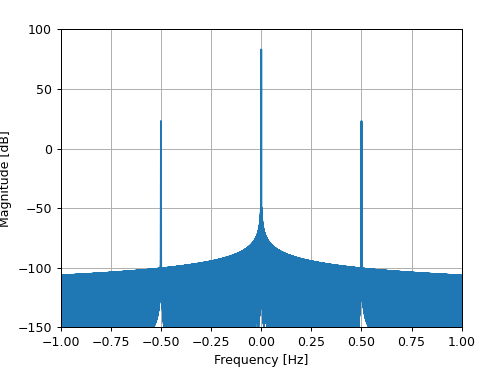
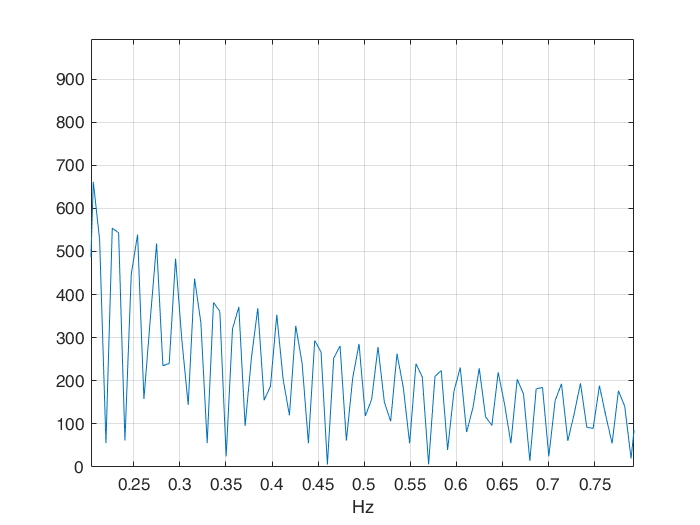
It is this function that would convolve in frequency with the actual waveform, which is a tone at DC ($F=0$ Hz) and a smaller tone at $F = 0.5$ Hz. Given that the waveform has been multiplied by the rectangular window in time, then the result from the convolution will be a Sinc centered at $F=0$ and another Sinc centered at $F=0.5$ each weighted by their respective magnitudes. Below I plot the result of each separately, while the final result would be the sum (superposition) of each of these spectrums. We see, as the OP described, that the 0.5 Hz waveform is completely buried by the sidelobes from the rectangular windowing of the stronger DC signal.
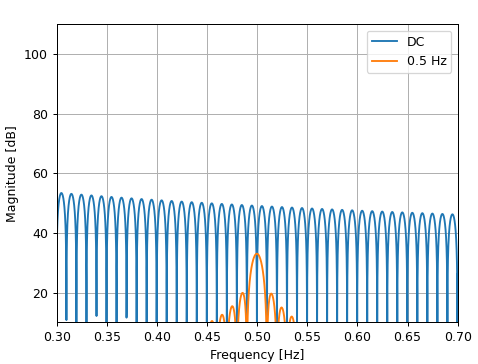
An immediate and obvious first strategy is to minimize the sampling rate and maximize the time duration to the extent that is possible. Once that is properly set further considerations can be made with using a different time domain window. I will first show the impact of changing the sampling rate to a more appropriate value. For the rectangular window, the sidelobes have first nulls at $f=1/T$ as I described, and their peaks will decrease at $1/f$. This means if we double the frequency the sidelobe will have gone down by -6 dB (we see this in the previous plot by comparing the sidelobe levels at $f=0.3$ Hz to $f = 0.6$ Hz). So similarly if we decreased the sampling rate from $f_s = 900$ to $fs = 10$ (which is sufficiently higher than our highest frequency of $f=0.5$ to not introduce significant aliasing effects), and correspondingly increase the time duration by $900/10 = 90$ we will have the same number of time samples but we will have reduced the sidelobe level at our frequency of interest (0.5 Hz) by $20 log_{10}(90) = 40$ dB. Inspecting the previous graph indicates that this would be more than enough and perhaps sufficient for a more immediate result without the further complexity of windowing (which I would still ultimately advise using, but my point here is the preeminence of this consideration in either case).
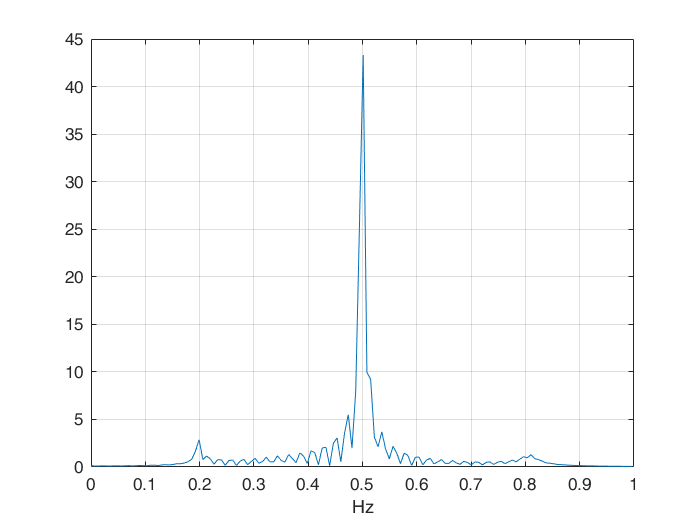
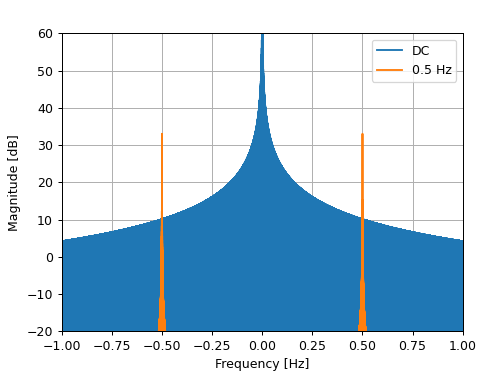
Spectrum with Sampling rate reduced to 10 Hz (and time duration extended by 90, same # of samples!) and we see directly the 40 dB predicted improvement:
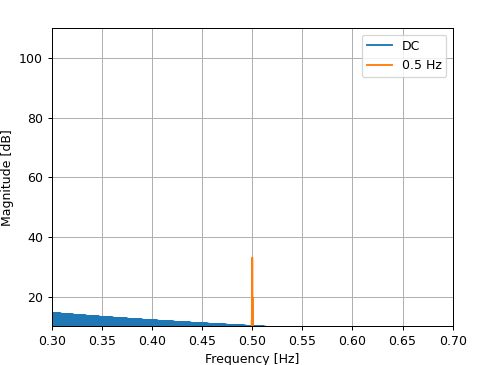
And zooming in on this new spectrum for direct comparison to the previous plot where the signal was buried:
And finally, showing what would traditionally be done which in addition to all first consideration above on minimizing sampling rate and maximizing time duration, is to multiply the time domain waveform with an improved window with the key property of having lower sidelobes than the rectangular window (but at the expense of losing frequency resolution: any window with lower sidelobes will have a wider main lobe). Below shows the end result with $f_s = 10 Hz$, $T = 9000$ and using a Kaiser Window, where the sidelobe is pushed down to -100 dB in vicinity of the waveform of interest!
