I want to prove using numpy the theory of Fourier transforms in which translation in space corresponds to a shift in the phase domain (frequency domain remains constant).
I have generated these three 2d-numpy arrays showing translated versions of the same boxes:
I then use numpy to calculate the FFT of each of these images doing:
H1 = np.fft.fft2(im1)
H2 = np.fft.fft2(im2)
H3 = np.fft.fft2(im3)
Although the frequency and phase plots of the transformed arrays look very similar I perform a comparison (MSE) between them to see the differences.
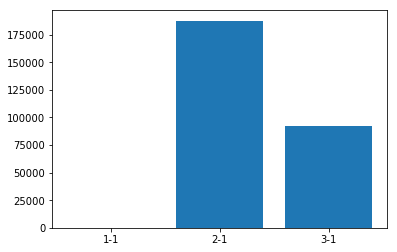
This is the MSE plot for the frequency domain:

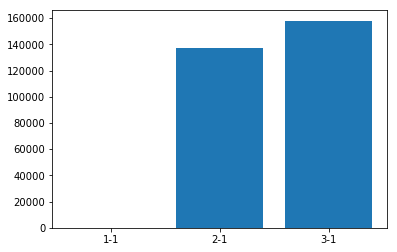
And this is the MSE plot for the phase domain:

I'm confused as I was expecting to see identical spectra in the frequency domain but different in the phase domain.
I would appreciate if someone can provide some insight to detect if the problem comes from a theoretical misunderstanding or a problem in the code.
Here is the code to replicate the results shown here.


