0
$\begingroup$

I'm reading "Fundamentals of Global Positioning System Receivers" section 7.3 "Maximum data length for acquisition" and it's talking about phase transition:

Theoretically, if there is a navigation data transition, the transition will spread the spectrum and the output will no longer be a cw signal. The spectrum spread will degrade the acquisition result. Since navigation data is 20 ms or 20 C/ A code long, the maximum data record that can be used is 10 ms. The reasoning is as follows. In 20 ms of data at most there can be only one data transition. If one takes the first 10 ms of data and there is a data transition, the next 10 ms will not have one.

In actual acquisition, even if there is a phase transition caused by a navigation data in the input data, the spectrum spreading is not very wide. For example, if 10 ms of data are used for acquisition and there is a phase transition at 5 ms, the width of the peak spectrum is about 400 Hz (2/ (5 × 10⁻³)).

My understanding was that the C/A signal is a pseudo-random Gold code that is XORed with the data (each data bit being 20*1023 chips long) and the resulting binary signal is BPSK-modulated.

So I would think phase transitions in the C/A signal (caused by the BPSK modulation) would occur much more often, not just between data bits but between chips, every few chips.

What is wrong in my understanding of the modulation of the text?

$\endgroup$

1 Answer 1

3
$\begingroup$

That text is confusing on its own as the spectrum spreading as transmitted is NOT affected as described. This is suggesting that if you acquire on any arbitrary 20 ms sequence of received data, your acquisition results will vary since a data transition can occur equally likely anywhere in that 20 ms given you select a random starting point for your acquisition. You avoid this whole issue by effectively performing acquisition using a 20 ms sliding correlation on 40 ms of received signal (assuming you want to maximize processing gain over the full 20 ms available).

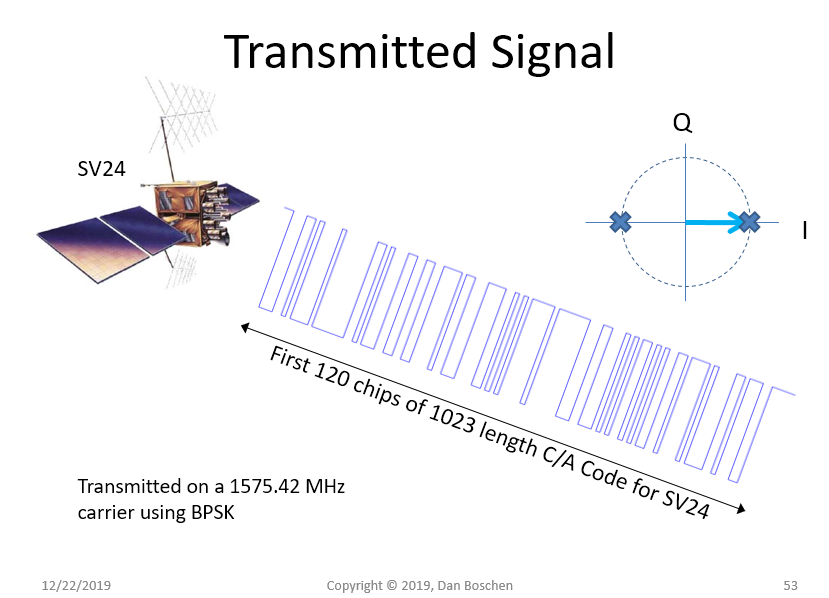
The BPSK modulation includes the C/A Code specifically making the carrier change back and forth 180°. The C/A code is 1023 chips long; when a C/A code chip is = 1, the carrier prior to data modulation (such as L1 at 1575.42 MHz) is transmitted with 0° phase reference. When a C/A code chip = 0, the carrier is transmitted with a 180° phase reference. The C/A code is at a 1.023 MSps rate, so there are 1023 phase transitions in each 1ms C/A code sequence.

Then there are 20 C/A code sequences in one data bit: Each data bit additionally toggles the carrier between 0 and 180°: So the C/A code is sent 20 times to send a "1" data bit, and the negative of the C/A code (0110... instead of 1001) is sent 20 times to send a "0" data bit. Thus the data rate is 50 bps.

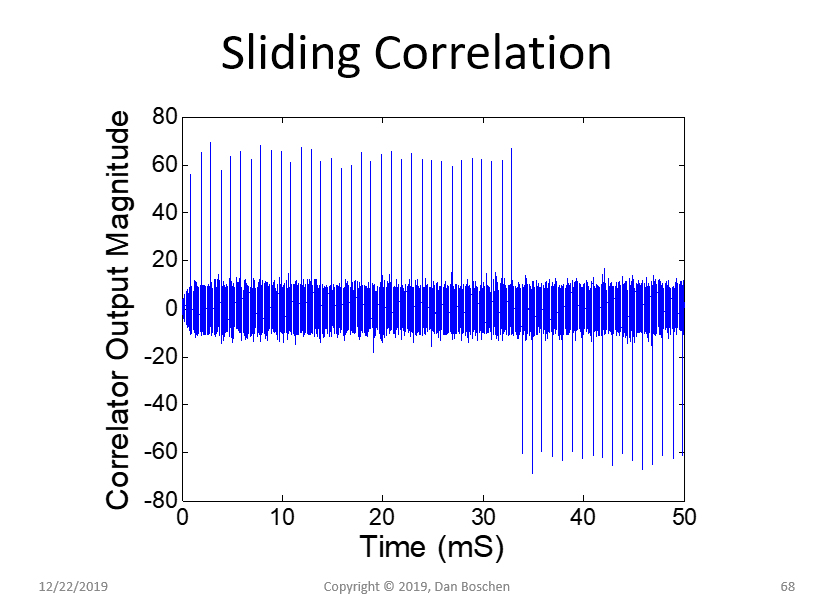
Below is an example of a correlation to SV24 for a single 1023 length sequence associated with that satellite from actual data captured from a GPS antenna with a digital sampling scope. The correlation was done by sliding the sample-matched 1023 length sequence through the received signal that in every other way appeared as white noise. With frequency offsets removed, the result appears as in the plot below showing the correlation peaks every 1 ms at every point in time that the local C/A code aligned with the transmitted C/A code. What we see in the plot is three data symbols (either 1 1 0 or 0 0 1 since phase ambiguity hasn't been removed).

gps

correlation magnitude result

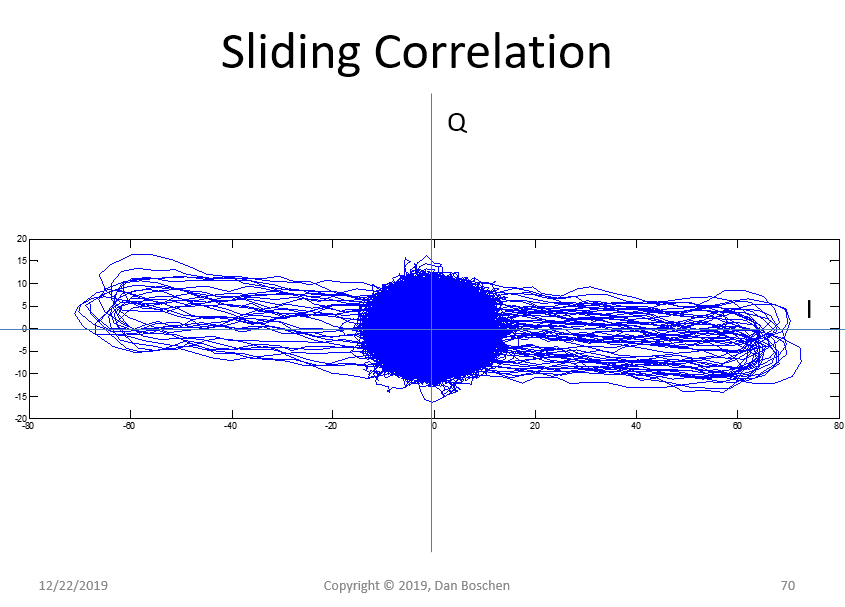
This is the same correlation result plotted on a complex plane (the above plot is the real part of this versus time). This shows how the carrier offset was removed and suggests carrier tracking approaches.

complex correlation result

$\endgroup$
9
  • 1
    $\begingroup$ This may help you: mathworks.com/matlabcentral/fileexchange/… $\endgroup$ Commented Dec 22, 2019 at 13:59
  • 1
    $\begingroup$ You need to remove your carrier offset such that your received signal is within 1/(2T) of baseband, where T is your correlation duration. Then you simply do a cross correlation which involves multiplying and accumulating at all possible time offsets. So if you correlate over 1 mS you want to get within 500 Hz of baseband. This will be enough to see complex peaks out of your correlator, that will be rotating at the residual frequency offset (see my updated plot where I removed all rotation). $\endgroup$ Commented Dec 22, 2019 at 14:10
  • 1
    $\begingroup$ This may also help: dsp.stackexchange.com/questions/30637/gps-signal-acquisition/… $\endgroup$ Commented Dec 22, 2019 at 14:12
  • 2
    $\begingroup$ ummm that may end up adding more complication--- -instead consider moving your received signal to DC as a complex I and Q signal by multiplying by sine and cosine of your guesstimate of the IF frequency and then multiplying that directly with your receiver -generated PRN. You can then measure your phase error directly from the I and Q correlator outputs, and if that phase changes from correlation to next correlation, that is a measure of your frequency offset that you can then correct in your down-conversion. $\endgroup$ Commented Dec 22, 2019 at 14:45
  • 1
    $\begingroup$ @axk You can only sample at 1.023MHz (1x chip rate) with a single correlator if you had no timing offset. 2xchip rate is ideal to drive a timing recovery loop. What is common is to run three correlators each at 1x chip rate and offset by 1/2 a chip from each other (Early, Prompt and Late). Early minus Late gives you the timing error and Prompt once timing offset is removed gives you your maximum correlated result. $\endgroup$ Commented Mar 6, 2020 at 19:57

Your Answer

By clicking “Post Your Answer”, you agree to our terms of service and acknowledge you have read our privacy policy.

Not the answer you're looking for? Browse other questions tagged or ask your own question.