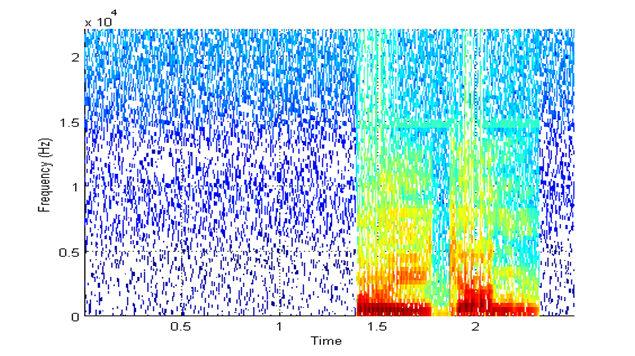
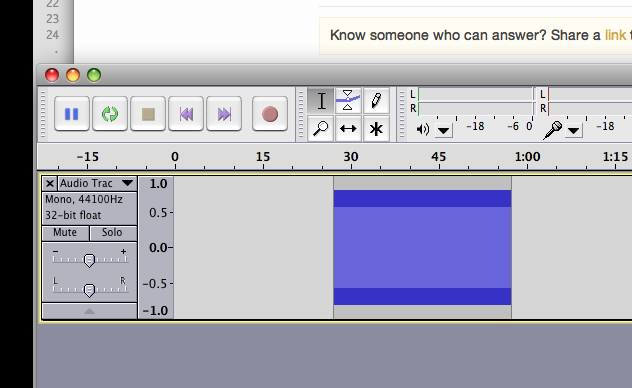
Here are the spectrogram plots:
Matlab version:

Audacity version:

the darker parts towards the right of the figure show speech. Silence was added to the left of the figure in audacity. This silent portion does not show any thing in the spectrogram as plotted by audacity which is as expected. but the same silence portion is covered with blue dots in case of the matlab plot. Why didn't Matlab plot it with all white (since it is silence added through software and is not supposed to have any energy)?
---EDIT: response to pichenettes' answer ---
I think you are right about the first explanation
The previous spectrogram was obtained by changing the time domain wave form view into spectrogram view immediately after I added silence. Actually in my case I had added silence at the end of the file to make it's length exactly equal to 2500ms, then cut and pasted to the beginning. So in my case it actually did show the time domain waveform of silence as well after insertion. But it seems that it does not actually include the 0's of silence in the wavfile until I export it. When I see the spectrogram of the wavfile after an export and a re-import, I an see blue dots in the audacity version as well

And teh difference in colour is probably due to the difference in colour palettes used, as pinchette had pointed out in his other answer

