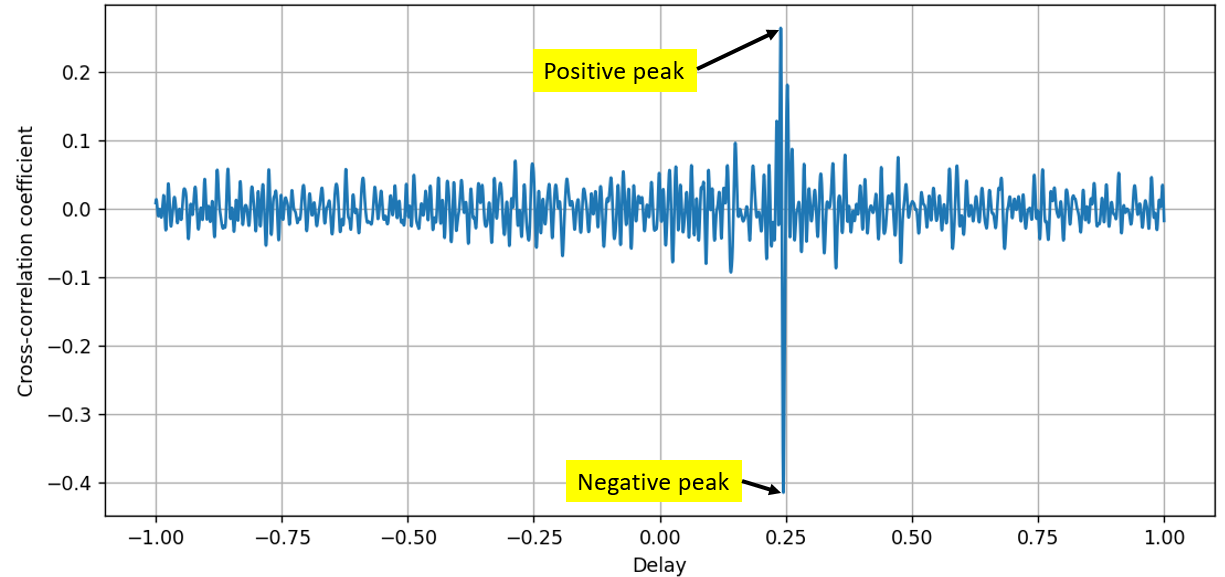
As your plot shows, the second form allows for the correlation peak to be negative. Now, what does a strong negative cross correlation mean? It means the signals are very similar, except one has a negative sign in front of it, i.e., $x_1 \approx -x_2$. Whether or not this makes sense depends a lot on the actual application.
In the application you describe, it would totally make sense to me. See, signals that are transmitted from a source and travel to a destination through some medium are subject to changes in their phase, either due to reflections or the transmission itself. A minus sign corresponds to the opposite phase, which can very likely represent the signal you are looking for, only having gone through an appropriate phase change.
So if I were you, I would allow for the correlation to be negative and look for peaks in the magnitude of the correlation function. Eventually, it still depends on the exact requirements of your application.
If you have the chance, I'd suggest to try some calibration measurements with known source and receiver positions to see what's going on. Then you could even compare both approaches.

